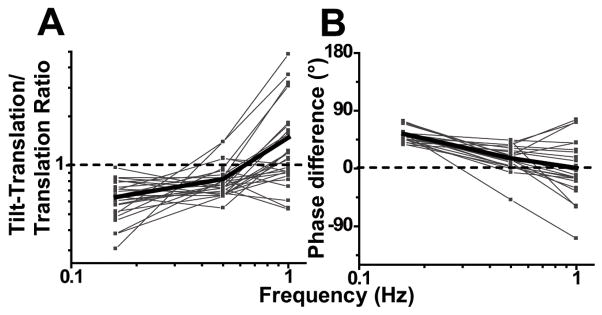
Fig. 8.
Dependence of the relationship between otolith and canal-driven signals on frequency. (A) Ratio of peak response modulation during tilt-translation (canal-driven response) relative to that during translation (otolith-driven response) plotted as a function of frequency. (B) Phase difference between the response modulation during tilt-translation and translation plotted as a function of frequency. Thin lines and symbols illustrate data from single neurons (n=23). Thick lines indicate population average.

