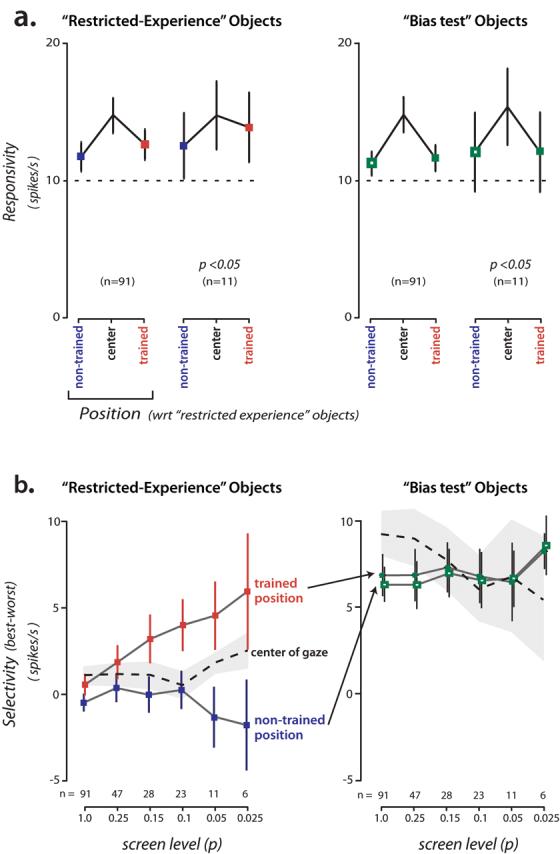
Figure 5.

Mean responsivity and selectivity (“best-worst”) of the IT population. a) Left: mean response to all four objects in the “restricted experience” object set at the two main experimental positions and at the center of gaze (see Fig. 3 for the mapping of these positions to absolute visual field position). Results are shown for all neurons and for a subset of highly selective neurons (selective among the “restricted experience” objects at p<0.05 at either position, ANOVA). Right: same analysis applied to the same neurons, but now for the responses to the “bias test” objects presented at the same three positions (see Methods). b) Left: Selectivity among the “restricted experience” objects (response to “best” object minus response to “worst” object) at each position (red shows trained position; blue shows equally eccentric, non-trained position; see Fig. 3). The plot shows results as a function of the ANOVA p value used for inclusion as “selective” among the “restricted experience” objects (neurons that reach this level of selectivity at either position are included). This plot is completely unbiased with respect to the two main experimental positions and the magnitude of selectivity (“best-worst”) is also unbiased (see Results). Dashed line shows the same “best-worst” analysis applied to the same neurons, but now using the neurons' responses to the same objects presented at the center of gaze (gray is SEM). Right: Selectivity using the same “best-worst” analysis applied to the same neurons, but now using the neurons' responses to the “bias test” objects at the two key positions and center of gaze (see Methods). This plot shows that selectivity among the “bias test” objects is very similar in the two key retinal positions, but direct comparison of the magnitude of selectivity with the “restricted experience” selectivity (left plot) is unsafe. Error bars indicate SEM.
