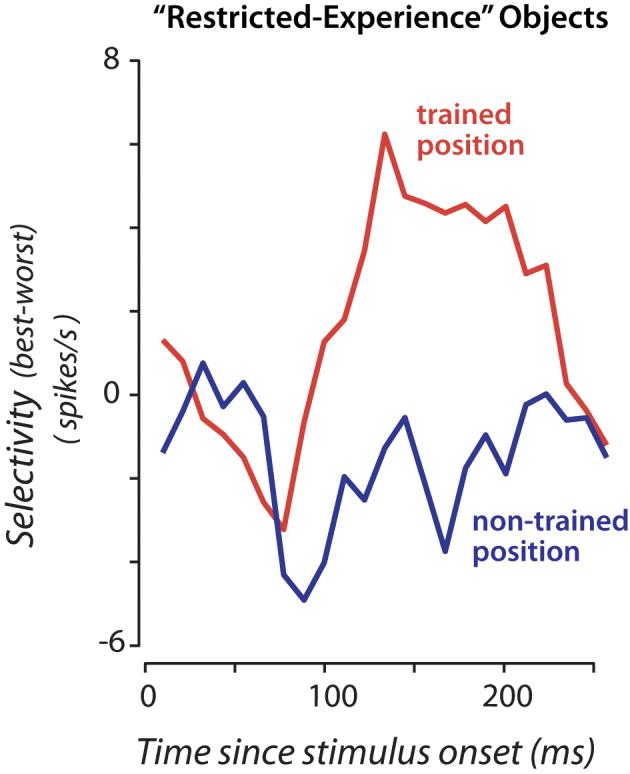
Figure 6.

Time course of selectivity for the “restricted experience” objects at the two key experimental positions. The responses of all neurons showing strong selectivity among the “restricted experience” objects at either position are included (p<0.05, n=11). X-axis is time since stimulus onset, y-axis is mean selectivity (over all the neurons) where “best-worst” selectivity was computed in an unbiased manner as described in Figure 5b and Results, but here using a 50 ms sliding window (10 ms steps). Quantitative assessment of the separation of the two curves is captured in Figure 5b.
