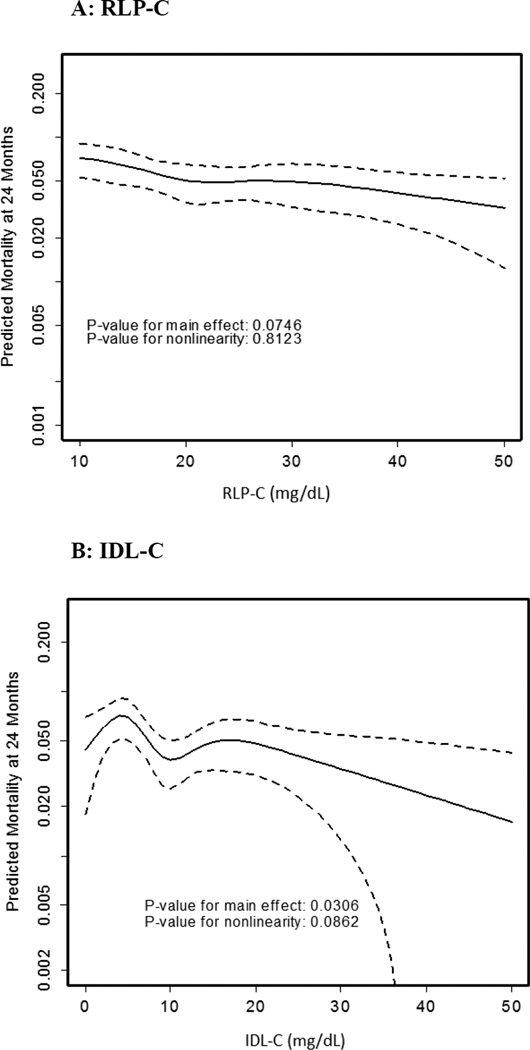
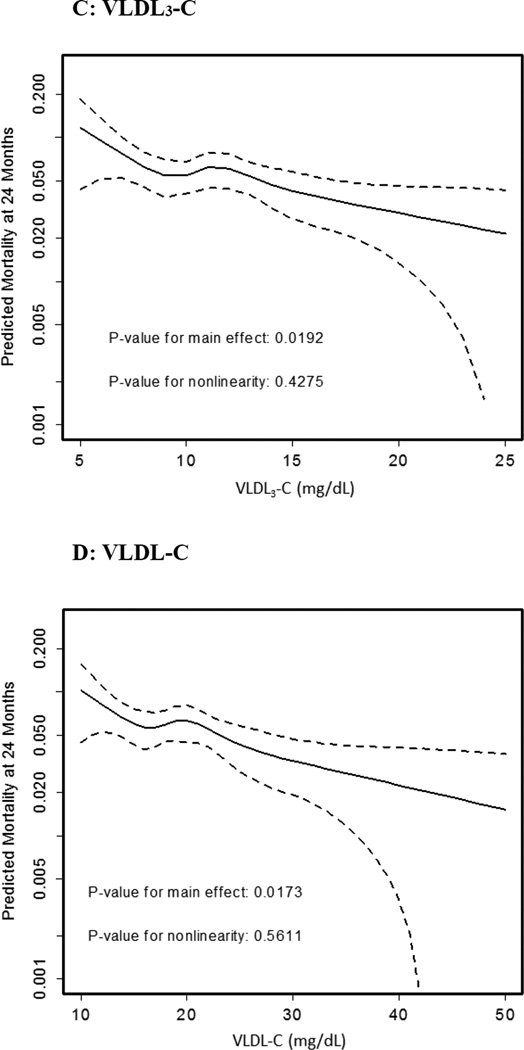
Figure 1. Adjusted Spline Curves of Remnant Lipoprotein Cholesterol Parameters in Association with Predicted Mortality.
Restricted cubic spline curves are presented. The x-axis represents observed values for remnant lipoprotein cholesterol parameters and the y-axis represents predicted mortality (log scale) at 2 years in TRIUMPH after adjusting for all covariates in the fully-adjusted model 3 (covariates listed in methods). Dotted lines indicate the 95% confidence interval. Panel A shows RLP-C, B) IDL-C, C) VLDL3-C, and D) VLDL-C. Results were consistent across model 1, 2, and 3; therefore, results from model 3 only are highlighted.


