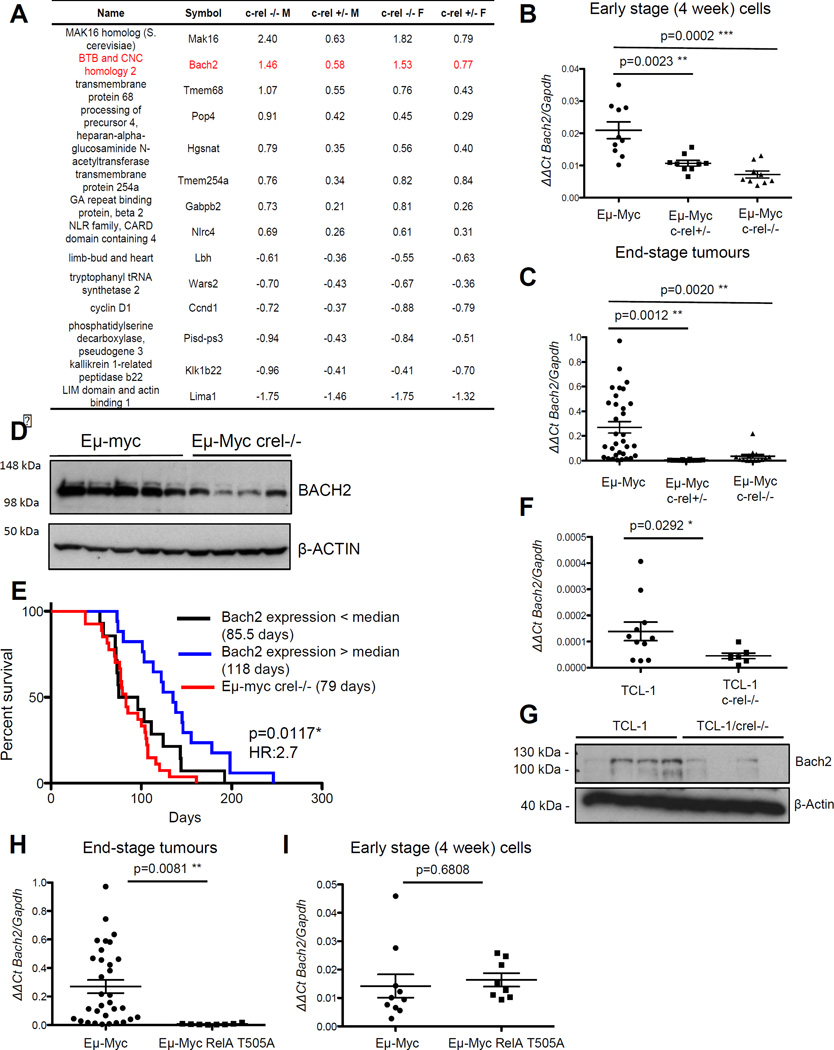
Figure 3. Expression of the B-cell tumour suppressor Bach2 is dependent on c-Rel in Eµ-Myc lymphoma.
(A) Table showing genes whose expression of regulated by c-Rel from microarray analysis of bone marrow derived B-cells from 4 week old Eµ-Myc, Eµ-Myc/c-rel+/− and Eµ-Myc/c-rel−/− mice. Fold changes shown are compared to equivalent wild type cells and are in log2 (a positive number indicates higher expression in wild type cells).
Bone marrow derived B-cells were purified from four-week old Eµ-Myc or Eµ-Myc/c-rel+/−, Eµ-Myc/c-rel+/− mice using CD19 microbeads (MACS Miltenyi Biotec, Surrey, UK). Total B-cell RNA, purified using the PeqGold total RNA extraction kit (Peqlab), was then used for microarray analysis at Cambridge Genomic Services using the Illumina mouse WG-6 Expression BeadChip system. This data was background corrected in Illumina GenomeStudio and subsequent analysis proceeded using the lumi and limma packages in R (Bioconductor)46–48. Variant Stabilisation Transform and Robust Spline Normalisation were applied in lumi. Differential expression was detected using linear models and empirical Bayes statistics in limma. A list of genes for each comparison was generated using a Benjamini-Hochberg false discovery rate corrected p-value of 0.05 as a cut-off.
(B&C) Confirmation that Bach2 mRNA levels are c-Rel regulated. Q-PCR showing relative Bach2 expression in (B) bone marrow derived B-cells from Eµ-Myc (n=10), Eµ-Myc/c-rel+/− (n=9) and Eµ-Myc/c-rel−/− (n=9) mice and (C) end-stage tumorigenic spleens from Eµ-Myc (n=30), Eµ-Myc/c-rel+/− (n=12) and Eµ-Myc/c-rel−/− (n=11) mice. Q-PCR was performed in triplicate on 20ng cDNA (Reverse Transcriptase kit, Qiagen), using predesigned Bach2 Quanititect Primer assays (Qiagen). Samples were run and analysed on a Rotor-gene Q system (Qiagen), using murine Gapdh primers as an internal control. All CT values were normalised to Gapdh levels using the Pfaffl method 49. Data represents mean ± SEM. p** <0.01, p***<0.001 (Unpaired Student’s t-test).
(D) Bach2 protein levels are reduced in Eµ-Myc/c-rel−/− mice. Whole cell extracts were prepared from Eµ-Myc or Eµ-Myc/c-rel−/− tumourigenic spleens. Cell pellets were washed with ice-cold PBS, and lysed using PhosphoSafe™ Extraction Reagent (Merck-Millipore), according to manufacturer’s protocols. Western blot analysis was performed using antibodies to BACH2 (ab83364 Abcam) or the loading control β-ACTIN (A5441 Sigma).
(E) Low levels of Bach2 mRNA correlate with poor survival in wild type Eµ-Myc mice. Kaplan Meier analysis of the survival of mice with below and above the median levels of Bach2 mRNA (from data in C). Also shown for comparison is the survival data from Eµ-Myc/c-rel−/− mice shown in Fig. 1F.
(F) Bach2 mRNA levels are c-Rel regulated in TCL1-Tg mice. Q-PCR showing relative Bach2 expression in end-stage tumorigenic spleens from TCL1-Tg (n=11), and TCL1-Tg/c-rel−/− (n=7) mice. Data represents mean ± SEM. p* <0.05
(G) Bach2 protein levels are reduced in TCL1/c-rel−/− mice. Whole cell extracts were prepared from TCL1-Tg or TCL1/c-rel−/− tumourigenic spleens and western blot analysis was performed as indicated.
(H&I) Low Bach2 mRNA levels in RelA T505A mice. Q-PCR showing relative Bach2 expression in (H) end-stage tumorigenic spleens from Eµ-Myc (n=30) and Eµ-Myc/relaT505A (n=8) mice and (I) bone marrow derived B-cells from Eµ-Myc (n=10) and Eµ-Myc/relaT505A (n=8) mice. Note data from wild type Eµ-Myc mice is the same as that shown in (C). Data represents mean ± SEM. p** <0.01 (Unpaired Student’s t-test). RelA T505A knock in mice were generated by Taconic Artemis (Germany) using C57Bl/6 ES cells.

