
Figure 3. Linear regression analysis of p53 and HLA-A2 expression in various wildtype p53 and mutant p53 tumor cell lines and the corresponding recognition by p53:264 TCR Td T cells.
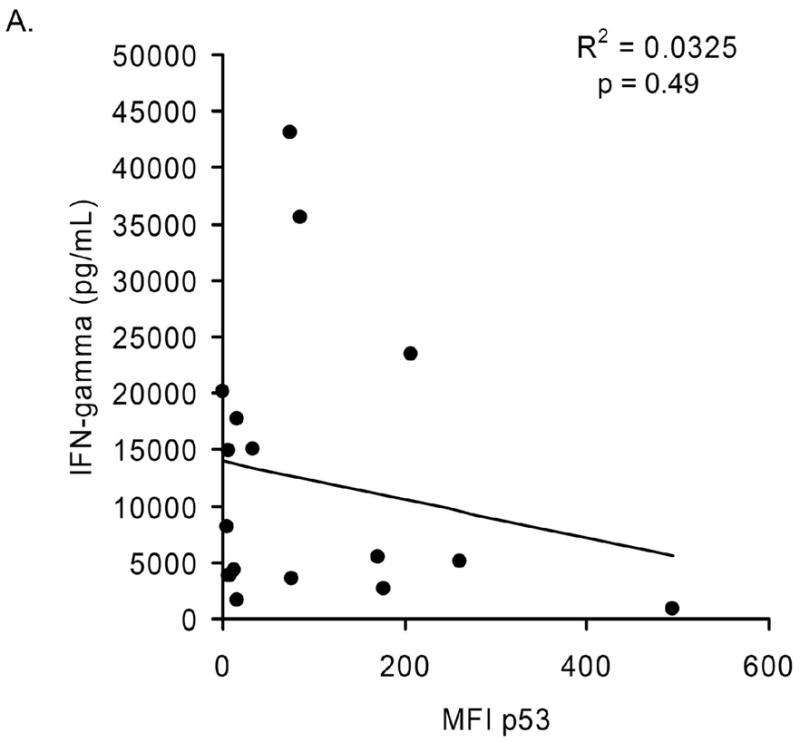
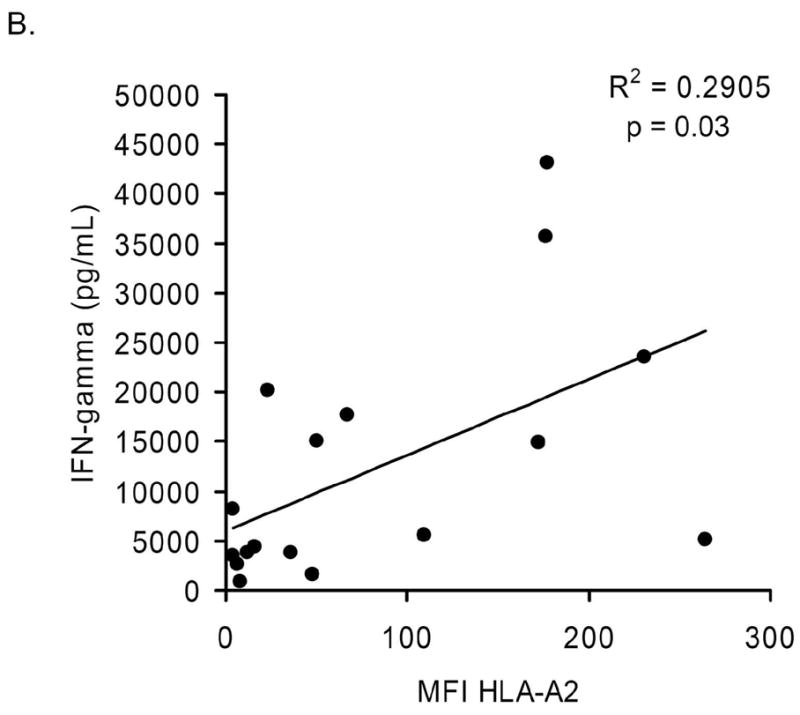
1 x 10⁵ p53:264 TCR Td T cells were cocultured overnight with 1 x 10⁵ HLA-A2+ tumor cell lines from various cancer origins including breast, colon, lung, melanoma, glioma, renal cell, ovarian, hepatocellular and hematopoietic tumors. In the same experiment, immunocytofluorometric analysis was performed to determine p53 and HLA-A2 expression levels assessed by MFI (corrected for the background MFI obtained with the isotype control, see Materials and Methods). The data plotted for patient 1 (IFN-γ values depicted in Table 2), and the correlation between (A) p53 expression or (B) HLA-A2 expression and IFN-γ production by p53:264 TCR Td cells are shown. Data are representative of 4 independent p53:264 TCR Td PBL tested against these tumors. Data for this analysis only included tumor cell lines that were HLA-A2+ and did not contain mutations within the p53 gene that are known to effect processing and presentation of the p53264–272 epitope.