
Figure 4. Specificity of p53:264 TCR Td T cells for tumor and normal cells.
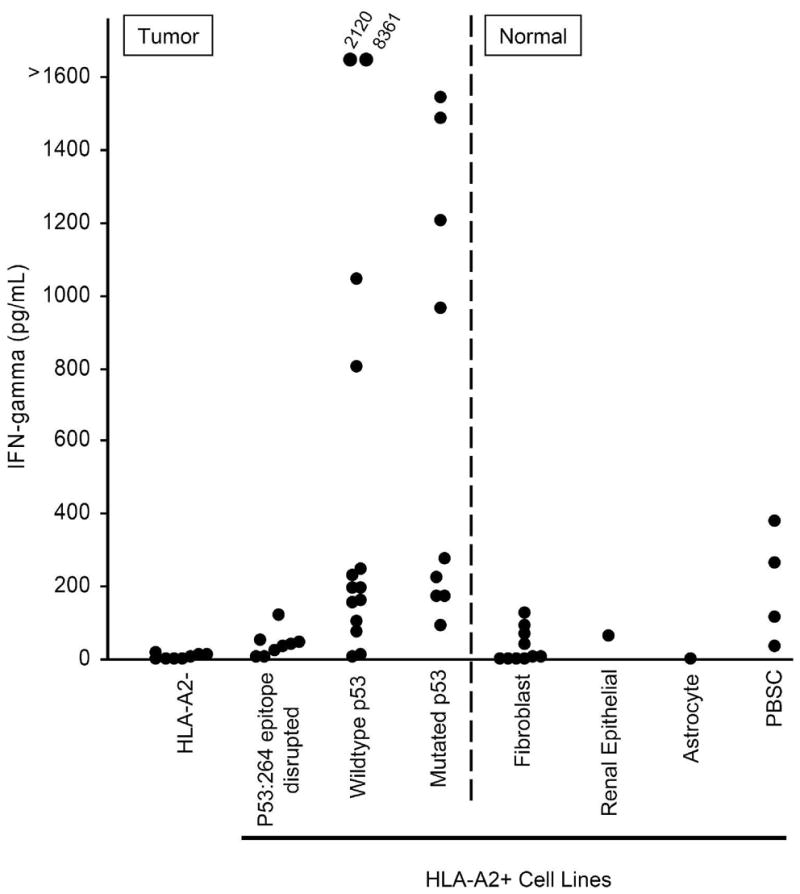
1 x 10⁵ tumor or normal cells were cultured overnight with 1 x 10⁵ p53:264 TCR Td T cells, supernatants collected and analyzed for IFN-γ by ELISA. Tumor and normal cell populations are separated by the divided line. Tumor cell lines included HLA-A2− (888, 938, A549, HCC-2998, HOP-92, IGR-OV1, KM12, and OVCAR-8), HLA-A2+, p53264–272 epitope disrupted (BIC-1, HCT-15, NCI H522, OVCAR 5, Saos-2, SW 620, TC71, SNB-19, U251), and HLA-A2+ tumor lines with an intact p53264–272 epitope containing either mutant (BT549, OVCAR 3, RXF-393, Saos2/143, SNB-75, 526, H2087, MDA 231, 1861) or wildtype p53 (A375, A498, HCT-116, HepG2, MALME-3M, MCF-7, SF 539, SK-MEL-5, 1890A375, A498, HCT-116, HepG2, MALME-3M, MCF-7, SF 539, SK-MEL-5, 1994, 2081, 2207, UACC 257, UACC 62). Normal cell lines included fibroblasts, renal epithelial line, and an astrocyte line. Peripheral blood stem cells (PBSC) were obtained freshly from patients following CD34+ selection and tested immediately. The data in this figure is compiled from 21 experiments utilizing the same p53:264 TCR Td effector T cell line, GLp53TCR, that had been previously expanded and cryopreserved, and the average IFN-γ value is reported for targets that were tested in multiple experiments (range 2 to 18 individual experiments). Recognition of targets tested in one experiment (e.g. PBSC) was validated with an additional p53:264 TCR transduced T cell line.