
Figure 5. Autologous p53:264 TCR Td T cell recognition of normal cell populations.


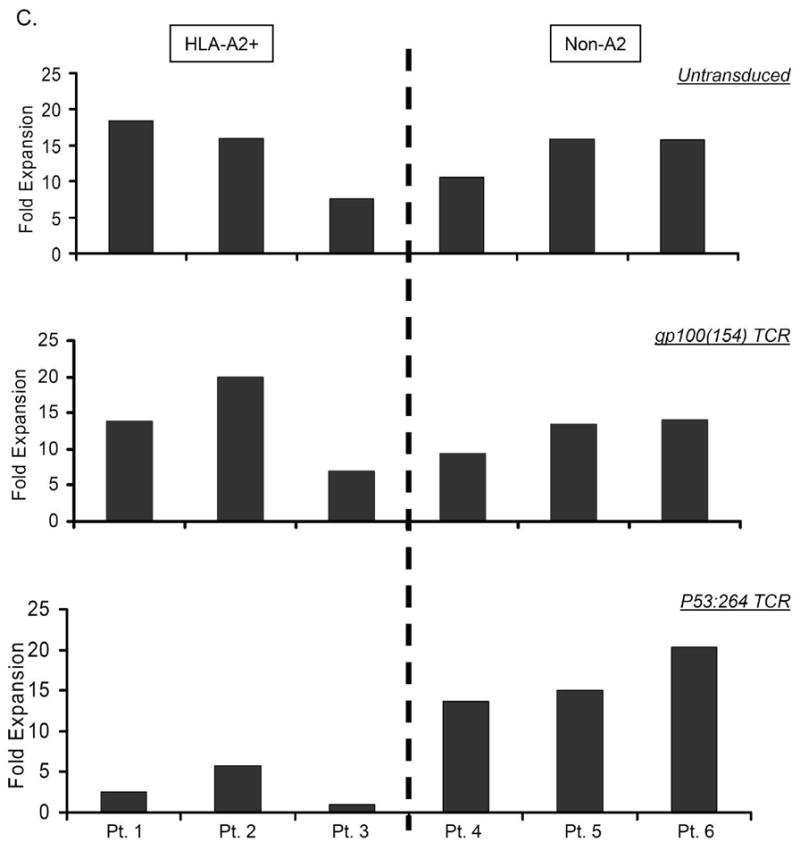
A, PBL from 3 patients were transduced with the p53:264 TCR or a control melanoma specific gp100:154 TCR similarly derived from HLA-A2.1 transgenic mice and expanded 8 days in vitro. Autologous targets from these 3 patients included peripheral blood stem cells (PBSC) that had been previously cryopreserved, activated PBL (aPBL) previously stimulated with OKT3/IL-2 for 4 days, or dendritic cells (DC) generated from plastic adherent purified PBMC cultured for 4 days in GM-CSF and IL-4. 1 x10⁵ transduced T cells were cultured overnight with 1 x 10⁵ tumor and normal target cells, IFN-γ was assessed by ELISA. SaOS2 (HLA-A2+p53−), H2087 (HLA-A2+p53+), MDA-231 (HLA-A2+p53+), and a HLA-A2+ melanoma line 2218 were used as tumor controls. The stimulation index represents the ratio of the IFN-γ production by p53:264 TCR Td T cells to the control melanoma specific T cells. A ratio less than 1 represents a cell line that stimulated the T cells transduced with the gp100:154 TCR to produce more IFN-γ than the p53:264 TCR Td T cells. B, PBL from 3 donors were left unstimulated or OKT3 stimulated and individual cultures cryopreserved on the indicated days. Intracellular FACS was performed in the same assay on all thawed samples to assess percent p53 positive cells (anti-p53 mAb, DO7 clone) gated on CD3+ cells. C, Donor PBL from 3 HLA-A2+ (Pt.1-3) and 3 HLA-A2− (Non-A2, Pt. 4–6) were stimulated and left untransduced (top) or transduced with a murine derived control melanoma specific, gp100:154 TCR (middle), or the p53:264 TCR (bottom) as in the Materials and Methods. Seven days after initial stimulation, the fold expansion of the individual cultures is shown in HLA-A2+ donor PBL (left side) and HLA-A2− PBL (right side).