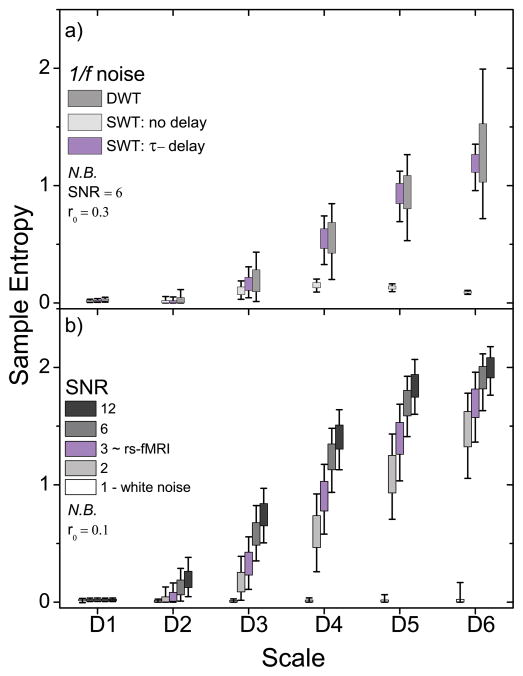
Figure 2.
Wavelet-based regularity analysis of simulated f-1 data (N=1024) depicting the effects of serial correlations and changes in SNR. a) Comparison of subsequence construction using a delay time (τ) adjusted for serial correlated behavior, no delay time (τ = 1), and a discrete wavelet transform (DWT) method that forms maximally whitened subsequences (see text). b) Entropy values for signals with SNR = 1 (white noise), 2, 3, 6, and 12 are shown. Subsequences were formed with τ adjusted for serial correlated behavior.

