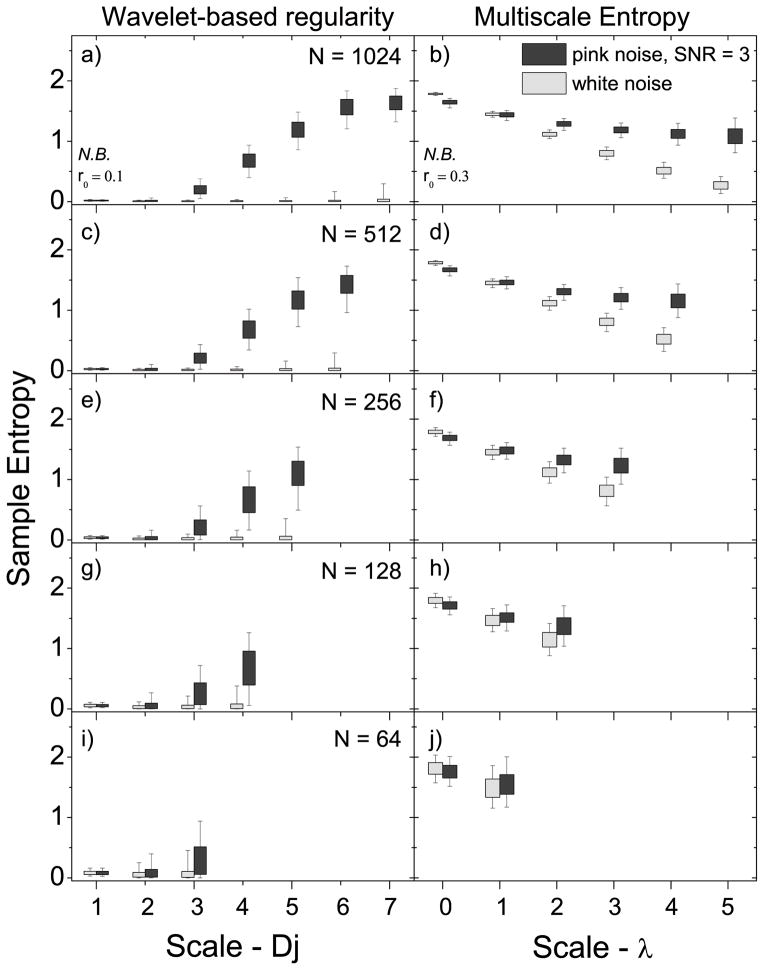
Figure 3.
The effect of signal length (N) on the ability to distinguish f−1 noise (with SNR = 3) from white noise for the wavelet-based regularity analysis (left side) presented in this paper and MSE analysis (right side). a–b) N = 1024, c–d) N = 512, e–f) N = 256, g–h) N = 128, and i–j) N = 64. The last three rows represent signal lengths typically studied in rs-fMRI. The scale λ = 0 corresponds to the original signal. Box plots show the 5-25-75-95 percentiles.

