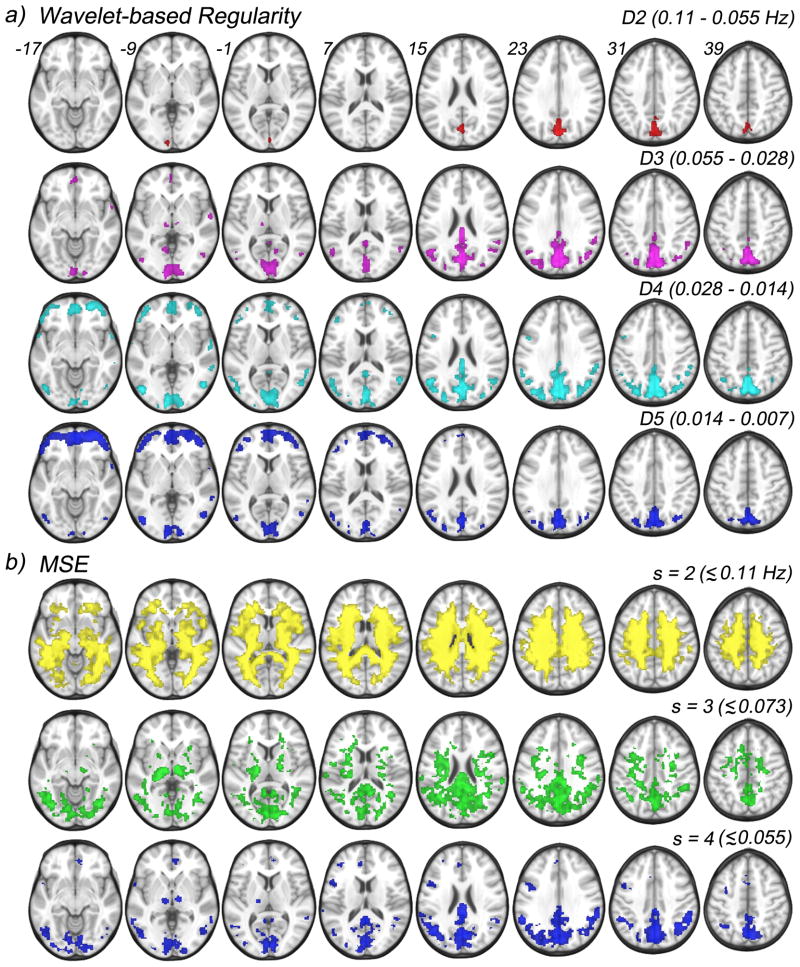
Figure 5.
One sample t-tests results performed against the global mean, scalewise, across both CDR 0 and CDR 0.5 groups of the wavelet-based regularity maps, and MSE maps. a) Four scales and their corresponding frequency ranges are shown for wavelet-based regularity: D2 (0.11–0.055 Hz), D3 (0.055–0.028 Hz), D4 (0.028–0.014 Hz), and D5 (0.014–0.007 Hz). b) Three scales and approximate frequency sensitivity range are shown for MSE analysis: s = 2 (< 0.11 Hz), s=3 (< 0.055 Hz), and s=4 (< 0.028 Hz).

