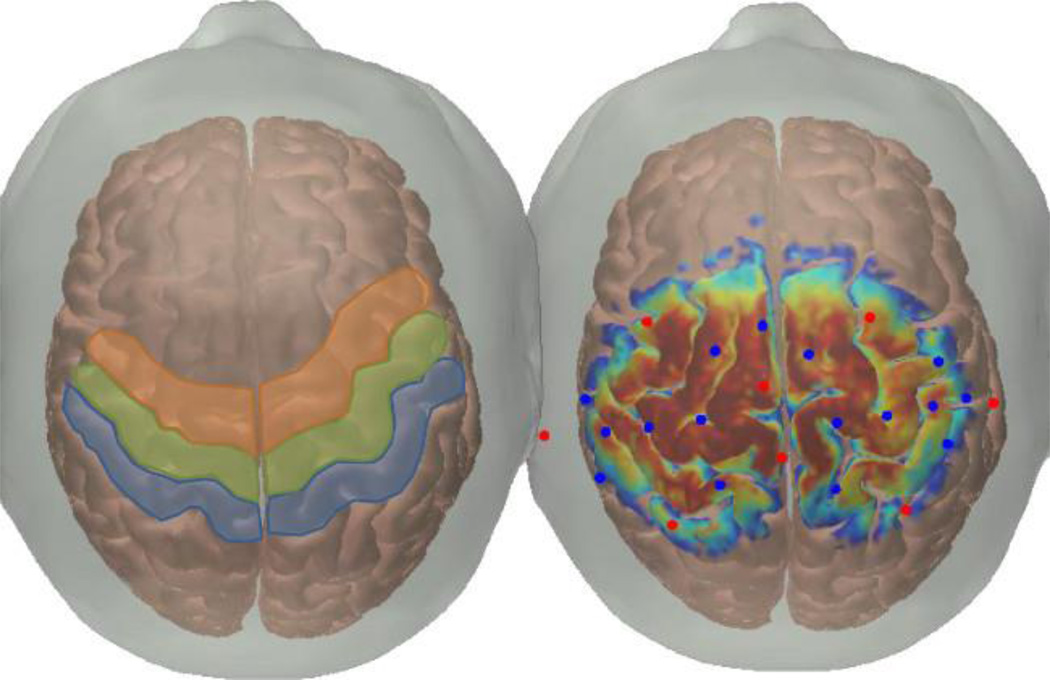
Figure 1. Probe location.
The left portion of this figure shows the approximate locations of the sensory areas (in blue, Brodmann areas 1,2,3), the primary motor area (in green, Brodmann area 4), and the premotor area (in orange, Brodmann area 6). The right portion of this figure was generated using Atlas Viewer GUI (available for open source download from the MGH Optics Division15) and its associated functions. In brief, this probe design was registered to the surface of the Colin47 Atlas using the spatial arrangement of sources, detectors, and anatomical landmarks (sources are represented by red circles and detectors by blue circles). A Monte Carlo photon migration forward model was run for launching 1 × 10⁸ photons of light through the materials of the skin, skull, and brain, with the sensitivity profiles for all source-detector pairs are projected to the surface of the cortex and all displayed simultaneously in this figure. The color map on the brain’s surface represents the cortical sensitivity of the probe; in other words the number of simulated photons that reach the gyri and sulci located under the sources and detectors (warmer colors indicate more photons than cooler colors, with a range of 2 orders of magnitude on a log 10 scale).

