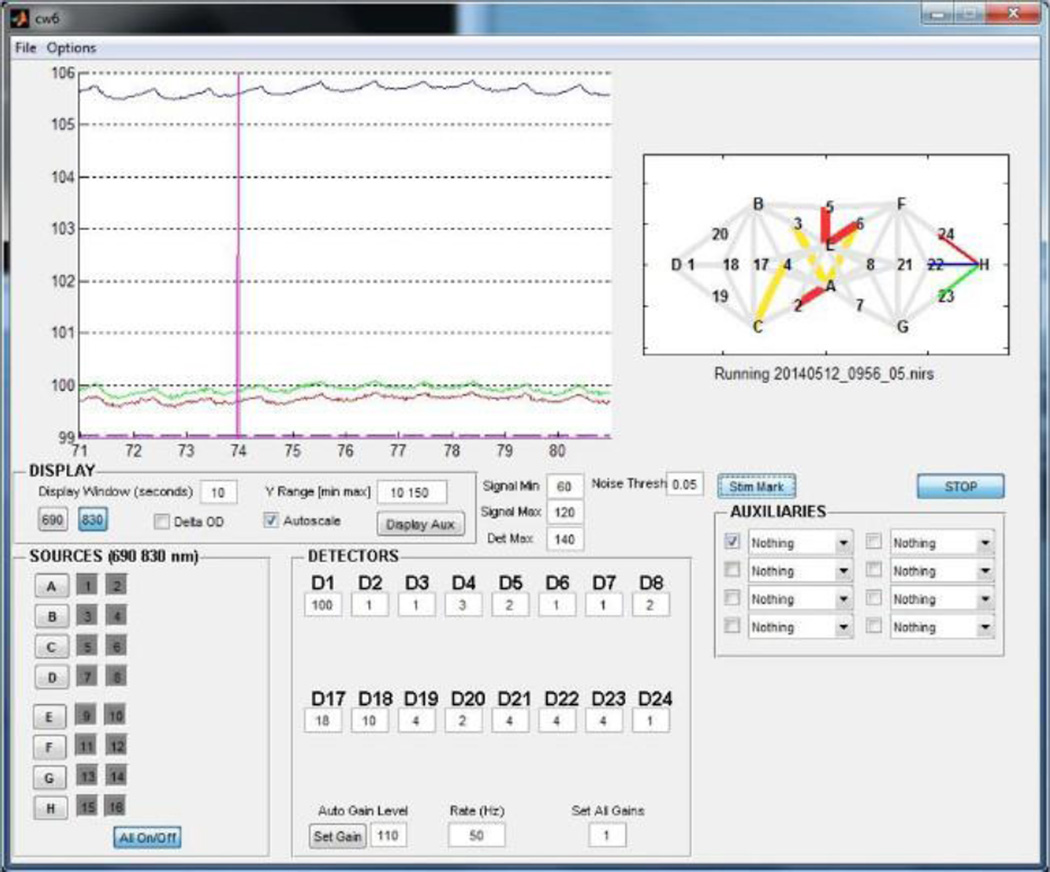
Figure 3. Example of optical density recordings.
This screen shot is from the data acquisition software of one type of fNIRS machine. It includes information about the fNIRS probe arrangement (upper right), ability to turn individual laser sources on and off (lower left), and options for modifying the gain of each dectector (bottom middle). In the data visualization window (top left), the vertical pink line represents the start of a block of activity. Colors of the traces correspond to the colors of the channels shown in the probe arrangement on the right. Note that all signals are above 80 dB, and the heart rhythm is clearly visible, even in the light intensity signal.

