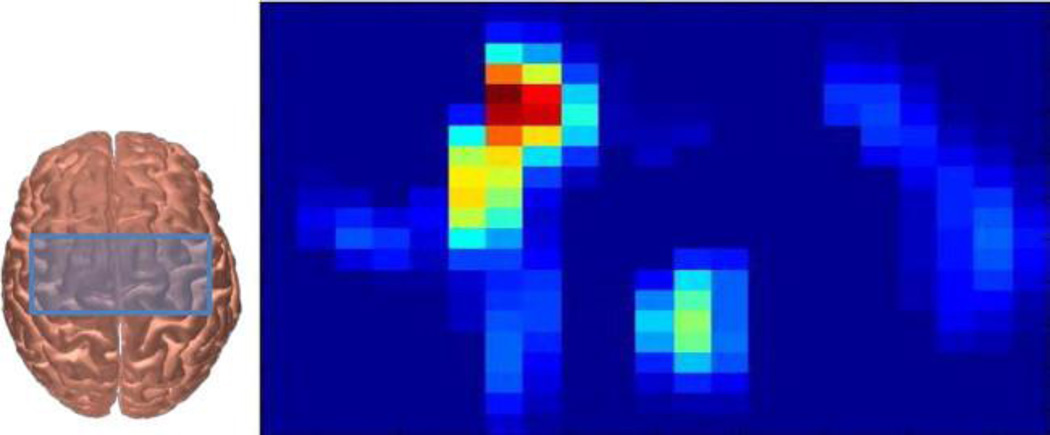
Figure 5. Example of fNIRS activation map during a right handed squeezing task.
The blue box on top of the brain outlines the approximate area sampled by this probe design (see also Figure 1). This participant was 13 years old, and had a head circumference of 56 cm). The right portion of the figure shows the average oxygenated hemoglobin (HbO) response during the period 5 – 10 sec following movement onset of one typically developing adolescent squeezing a ball with their right hand. This data in this figure are generated from HOMer14, and then evaluated using a general linear model. The blue colors represent no activation, while the red areas indication regions of increased HbO during the task periods. This is one method of analysis and visualization that researchers use to identify areas of greater changes in oxygenated and/or deoxygenated blood flow.

