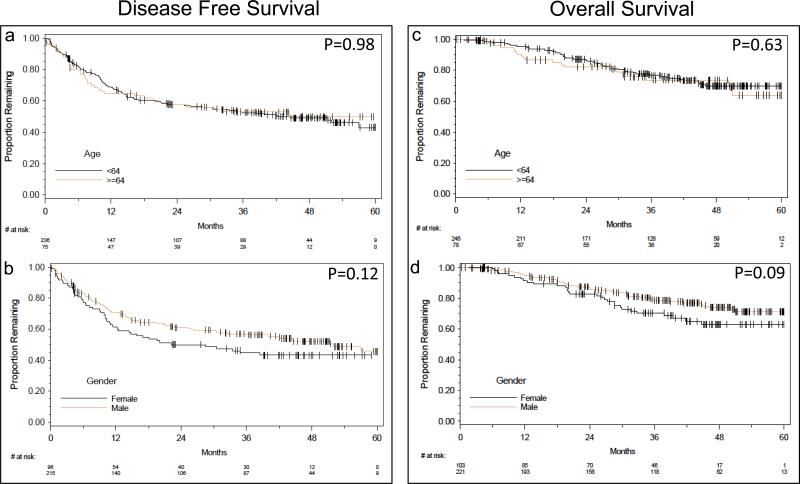
Fig. 3.
Kaplan-Meier survival graphs of age (top) and gender (bottom) versus disease free survival (DFS) and overall survival (OS) starting at 8 weeks to maximum of 60 months follow up period. DFS is shown on the left column and OS on the right column a. Association between age and DFS b. Effect of gender on DFS c. Age versus overall survival d. Gender versus overall survival

