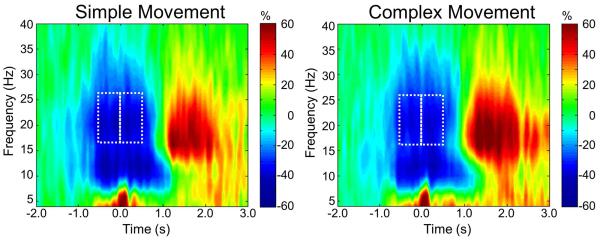
Figure 3. Group-averaged time-frequency spectra during simple and complex movements.
Time (in s) is denoted on the x-axis, with 0.0 s defined as movement onset. Frequency (in Hz) is shown on the y-axis. All signal power data is expressed as a percent difference from baseline, with the color legend shown to the far right. Data represent a group-averaged gradiometer sensor near the left sensorimotor cortex (the same sensor was selected in each participant), and was computed separately for the simple (left panel) and complex movement (right panel) conditions. Prior to and during movement, there was a strong alpha/beta desynchronization (ERD) in both conditions. In many sensors, a break between alpha and beta ERD responses could be discerned, with clearly weaker activity between 12-15 Hz. After movement offset, participants exhibited a strong PMBR in both conditions. The white boxes in each image denote the time-frequency bins that were selected for beamforming analysis. The motor planning stage was imaged from −0.45 to 0.0 s at 16-26 Hz, whereas motor execution was imaged from 0.0 to 0.45 s at 16-26 Hz. The same time-frequency bins were imaged for both simple and complex movements.

