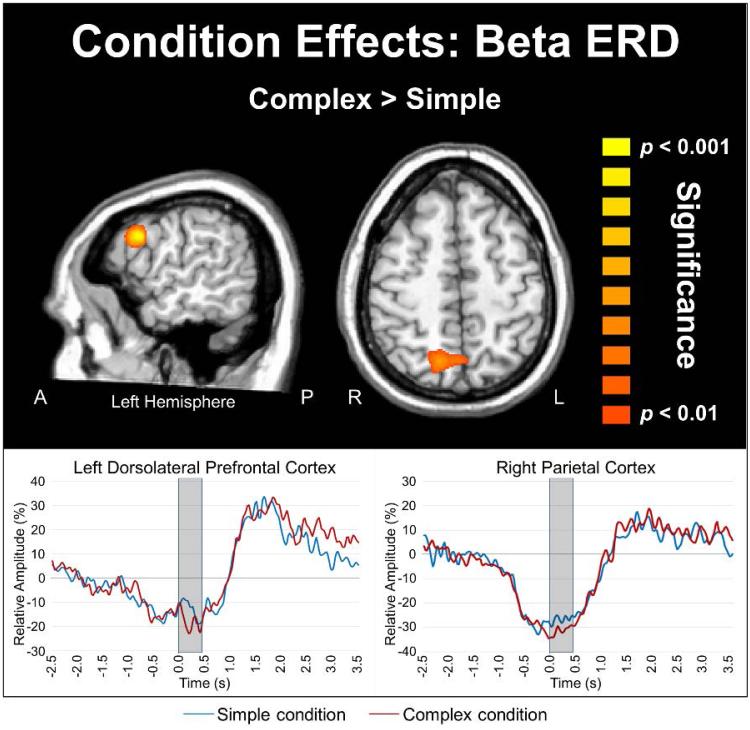
Figure 5. Stronger beta ERD amplitude during complex movements.
Participants exhibited significantly stronger beta ERD in the left DLPFC (p < .001, corrected) and the right superior parietal cortices (p < .001, corrected) during the execution of complex relative to simple movements (0.0 to 0.45 s, 16-26 Hz). There were no significant differences (p > .10, corrected) between complex and simple sequences during the motor planning stage. For the time series, the simple condition is shown with a blue line, while the complex condition is shown in red. Axial slices are shown in radiologic convention (right = left).

