Figure 4.
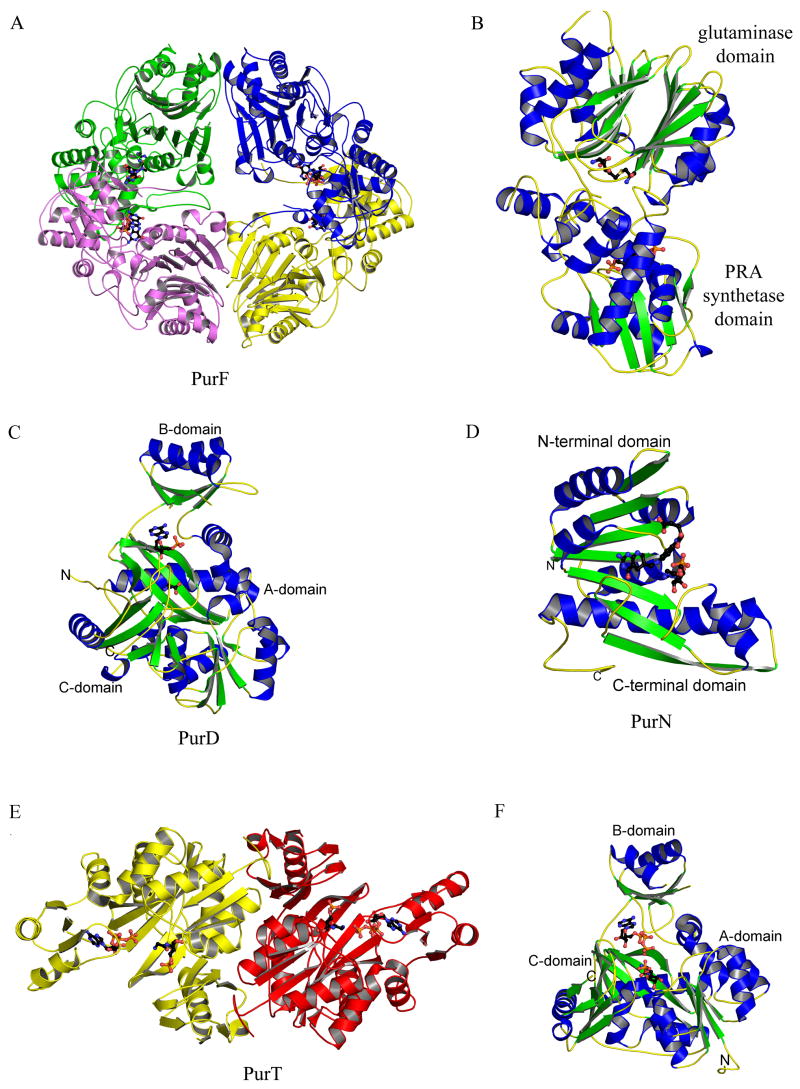
Structures of PurF (step 1), PurD (step 2), PurN (step 3) and PurT (step 3a). (A) Ribbon diagram of the E. coli PurF (PDB: 1ECB) tetramer. Each monomer is in a different color, and the inhibitor, GMP, is in ball-and-stick representation, colored by atom type (with carbon black, oxygen red, nitrogen blue, sulfur yellow, and phosphorus orange, throughout). (B) Ribbon diagram of a monomer of E. coli PurF (PDB: 1ECC), color-coded by secondary structure. Ligands, Gln and cPRPP, bound in the active sites are in ball-and-stick representation. (C) Ribbon diagram of Geobacillus kaustophilus PurD (PDB: 2YS6), color-coded by secondary structure. Glycine and AMP, found in the active site, are in ball-and-stick representation. (D) Ribbon diagram of E. coli PurN (PDB: 1CDE), color-coded by secondary structure. The substrate glycinamide ribonucleotide and the inhibitor 5-deaza-5,6,7,8-tetrahydrafolate are in ball-and-stick representation. (E) Ribbon diagram of the E. coli PurT dimer (PDB: 1KJ8), color coded by monomer. The substrate, glycinamide ribonucleotide (GAR), and ATP are shown in ball-and-stick representation. (F) Ribbon diagram of the E. coli PurT monomer, color-coded by secondary structure. GAR and ATP are shown in ball-and-stick representation.

