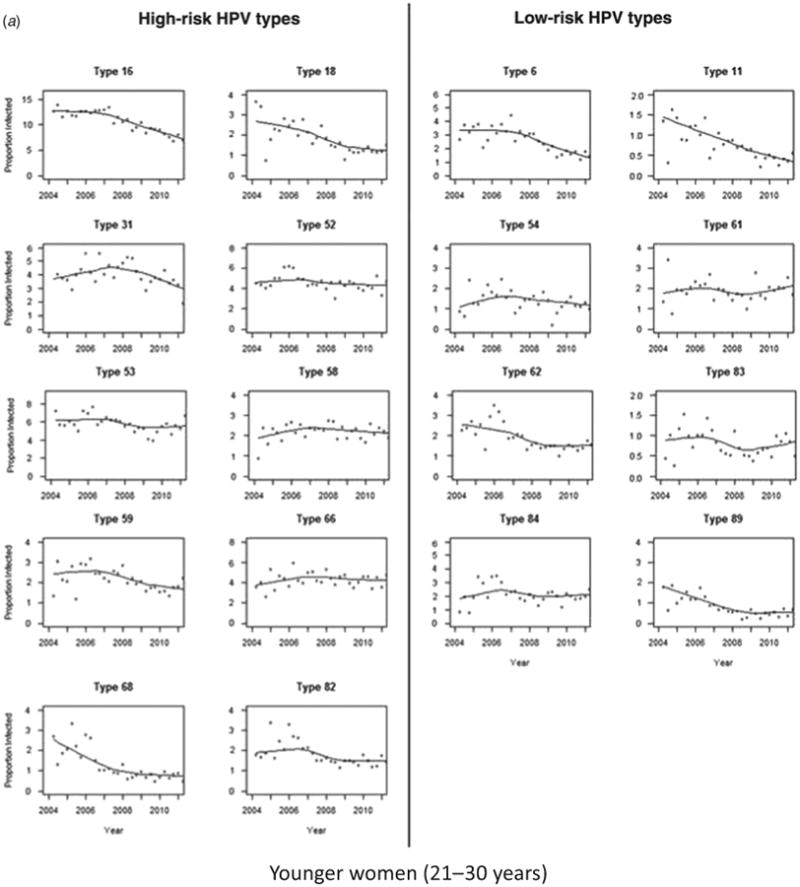
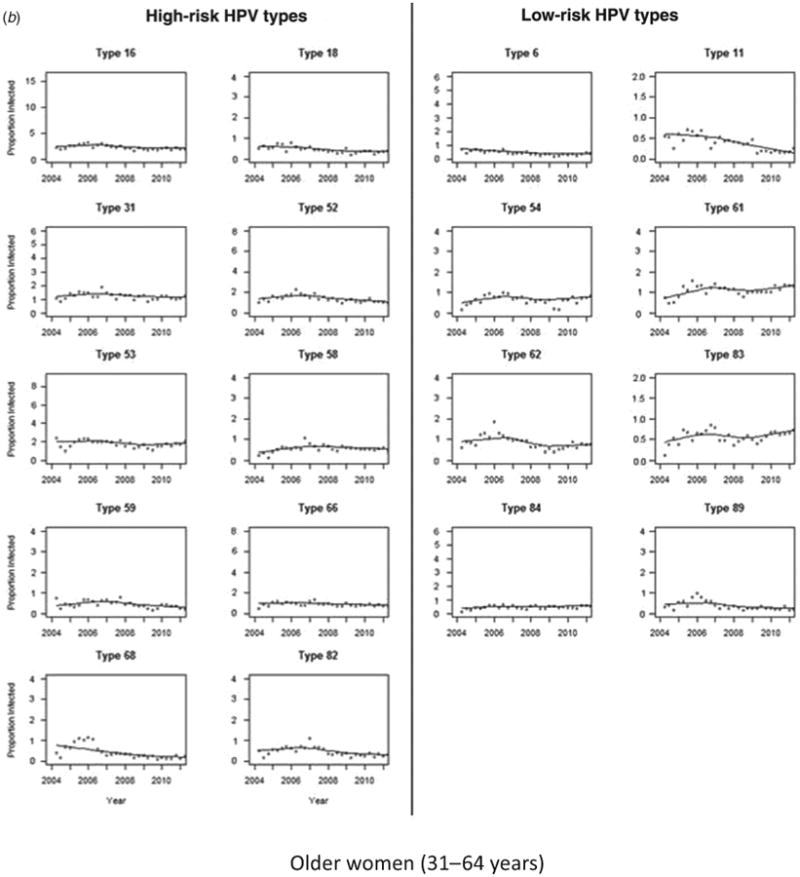
Fig. 2.


Infection rates over time by human papillomavirus (HPV) type. Infection rates by HPV type are defined as the number of new positive infections per total number of women tested within a 3-month period. Changes over time are represented by Lowess smoothing curves (solid black line). (a) Younger women (21–30 years); (b) older women (31–64 years).
