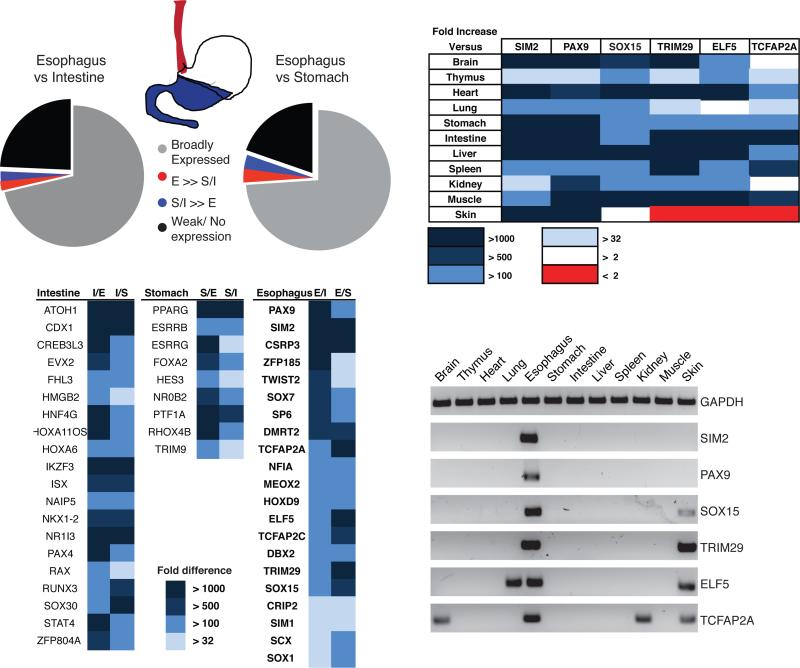
Figure 1. Differential TF expression in the normal mouse gut and other tissues.
(A) Distribution of all TFs in wild-type mouse digestive epithelia, as revealed in a qRT-PCR screen. Expression of 1,880 TF mRNAs was assessed in epithelial cell isolates from adult CD1 mouse esophagus (red), stomach and intestine (blue). (B) TFs restricted to intestinal (I), stomach (S) or esophageal (E) epithelium, with the fold-excess over other tissues represented in shades of blue. (C) Relative expression of Sim2, Pax9, Sox15, Trim29, Elf5 and Tcfap2a mRNAs in mouse tissues. The fold-excess values are represented in shades of color as indicated in the key. (D) Products of qRT-PCR for the 6 most highly esophagus-specific TF mRNAs in 12 adult mouse organs, showing selective expression in the esophagus and of some factors in the skin.

