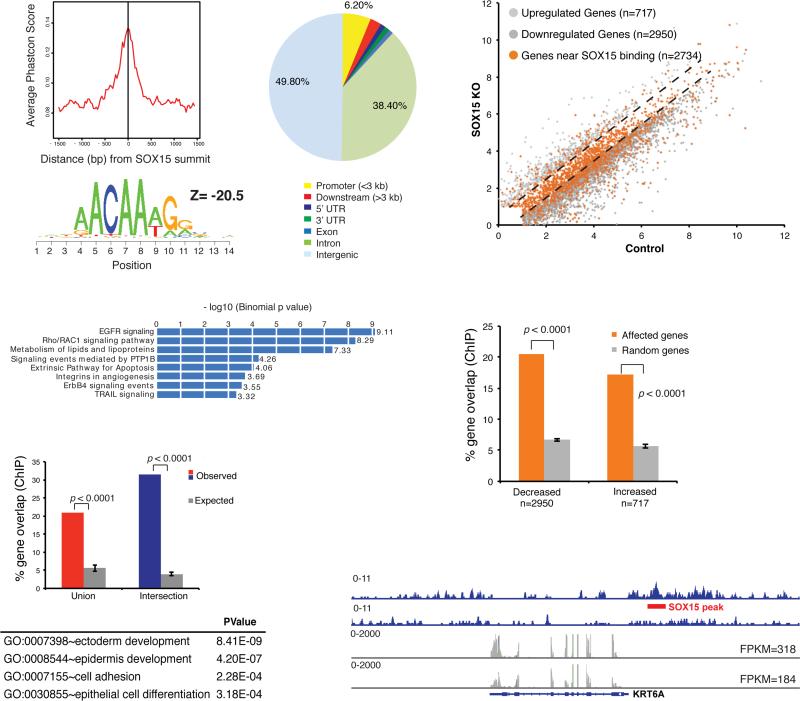
Figure 4. Genome-wide SOX15 occupancy and gene dependence in human esophageal cells.
(A) Summary of ChIP analysis for biotinylated SOX15 in CP-A cells, showing high sequence conservation and significant enrichment of a canonical SOX recognition motif ACAA(A/T)G among 4,864 identified binding sites. SOX15 mainly binds DNA far from promoters. (B) GO terms enriched among the 2 nearest genes within 50 kb of SOX15 binding sites, determined using GREAT (29). (C) Percentages of esophagus-specific genes (as determined in Fig. 2A, red: union, blue: intersection set) that bind SOX15 within 50 kb of the transcription start site (TSS), compared to 5 random gene sets of equivalent size (grey bars, P <0.0001). The table lists GO terms enriched among genes from the esophagus transcriptome that lie within 50 kb of SOX15 binding sites. (D) SOX15 binding (orange dots) within 50 kb of genes expressed in SOX15-depleted and control CP-A cells (grey dots, q <0.05, as in Fig. 2B). Dashed lines demarcate genes unaffected by SOX15 loss. (E) Genes reduced or increased in SOX15-depleted cells are significantly enriched for nearby SOX15 binding. Together with the proportions of orange dots in D, the data imply direct SOX15 activation of many, and direct repression of fewer genes. (F) Integrated Genome Viewer representation of esophageal gene KRT6A, showing SOX15 binding at the locus (top rows, blue, ChIP-seq tags) and reduced expression in SOX15-depleted CP-A cells (bottom rows, grey, RNA-seq tags). Numbers represent the height of the y-axis.

