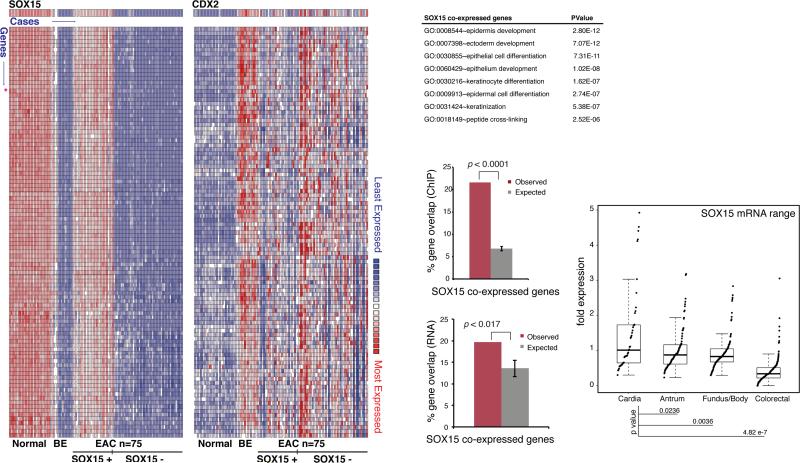
Figure 5. SOX15 expression in esophageal adenocarcinomas.
(A) Gene co-expression profiles for SOX15 (left) and CDX2 (right) in a large collection of normal, BE and EAC epithelium (23). 317 transcripts correlated strongly (r >0.81) with SOX15 mRNA levels in normal esophagus and in approximately 1/3 of 75 EACs in this series. The 100 most highly correlated genes are shown. (B) GO term enrichment among these 317 SOX15-coexpressed genes. (C) Top: Fraction of SOX15 co-expressed genes showing SOX15 occupancy (Observed) within 50 kb, compared to the fraction expected for appropriate random gene sets of equal size. Bottom: Fraction of SOX15 co-expressed genes affected by SOX15 depletion (Observed), compared to the fraction expected among random gene sets of equal size. (D) Ranges of SOX15 mRNA expression extracted from RNA-seq data on TCGA collections of cancers of the gastric cardia, fundus/body and antrum (30), or colon and rectum (42). Significance of differences was determined by the t-test.

