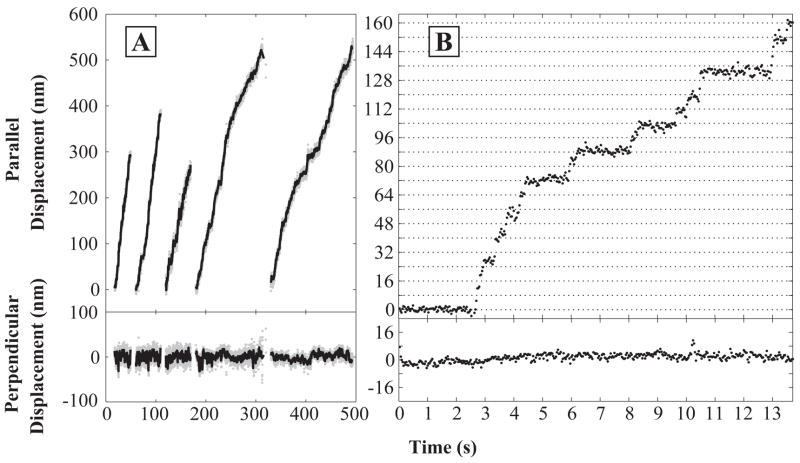
Figure 4.
(A) Movement records of five individual bead-labeled wild-type/R210K heterodimer molecules in 1 μM ATP. Samples were prepared at 1:1 enzyme dimer:bead mole ratios and observed at 22–23°C. Traces show bead movements both parallel (top panels) and perpendicular (bottom panels) to the microtubule axis. Positions were recorded at 30 Hz (gray) and smoothed with a 10-point mean filter (black). (B) Expanded plot of a portion of a run taken at 0.5 μM ATP that shows individual ~8 nm steps. Horizontal grid lines are spaced at 8 nm intervals.

