
Table 1.
ATPase Activity and Motility of Kinesin Derivatives
| Enzyme Species a | ATPase Activity b (mean ± S.D.) (s−1) | Movement Velocity c (mean ± S.D.) (μm s−1) | Run Frequency c (mean ± S.E.) (min −1) | Run Length c (± S.E.) (μm) |
|---|---|---|---|---|

|
24.3 ± 0.5 (N = 6) | 0.8 ± 0.2 (N = 79) | 1.0 ± 0.2 (N = 25) | ≥1.5 ± 0.1 d (N = 79) |

|
0.19 ± 0.02 (N = 6) | <0.00010e (N = 8) | <0.04 e | No motility |
|
10.0 ± 0.1 f (N = 3) | 0.09 ± 0.12 (N = 50) | 0.4 ± 0.1 (N = 10) | 0.31 ± 0.06 (N = 50) |
|
|
0.18 ± 0.02 (N = 3) | N.D.g | N.D.g | N.D.g |
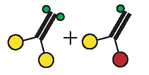
a
Schematic diagrams of enzyme species present, using the same symbols as in Figure 1.
b
Microtubule-stimulated ATPase specific activity per dimer (rows 1–3) or per monomer (row 4) in 1 mM ATP, 1.2 mg/ml microtubules, 25 °C.
c
In single-molecule bead movement assay at 1:1 enzyme dimer:bead mole ratio, 1 mM ATP, 22–23 °C.
d
Data set included some runs where motor ran off the microtubule end.
e
No motility detected. Value given is the detection limit.
f
Implies that heterodimer specific activity is ~15 s−1, since the preparation is estimated by gel densitometry to contain ~35% mutant homodimers, which have negligible activity.
g
Not determined.