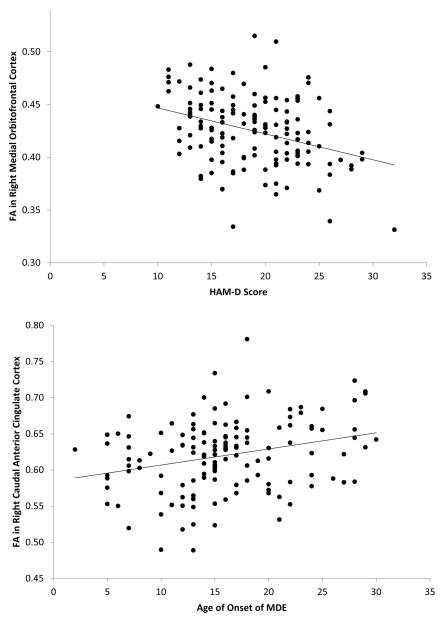
Figure 2.
Top: Scatterplot depicting the relationship between fractional anisotropy (FA) in the right medial orbitofrontal cortex (MOFC) and Hamilton Depression Rating Scale scores (HAM-D) in the major depressive disorder (MDD) group. Bottom: Scatterplot depicting the relationship between FA in the right caudal anterior cingulate cortex (cACC) and age of onset of depression in the MDD group.

