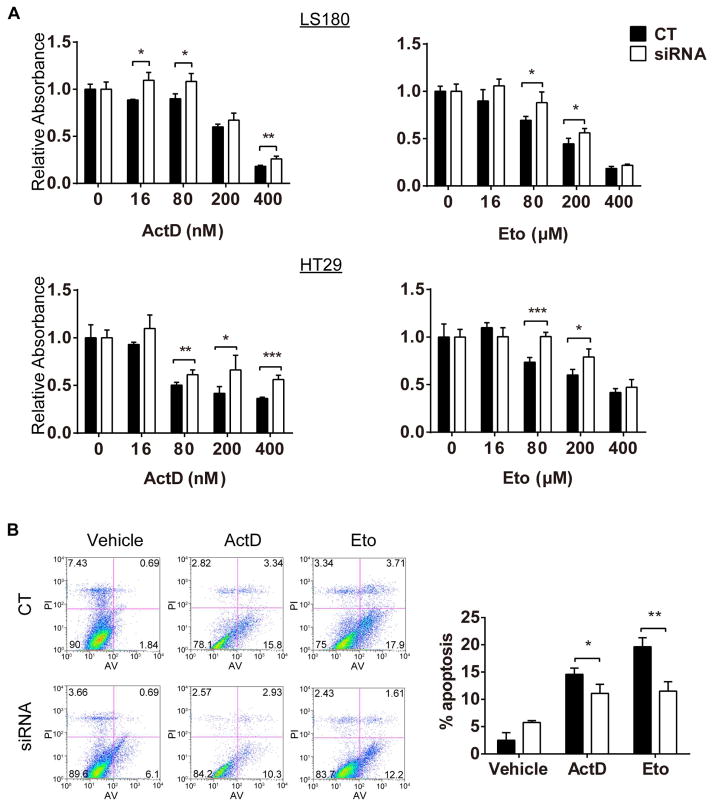
Figure 2. UGT1A silencing lowers the anti-proliferative activity of actinomycin D and etoposide in both HT29 and LS180 cells.
Cells were pretreated with UGT1A siRNA1 or non-specific siRNA for 24 hours and then exposed to gradient concentrations of actinomycin D or etoposide for 36 hours. (A) Cell proliferation was measured by MTT assay in actinomycin- or etoposide-treated LS180 and HT29 cells. The proliferation rate of cells is expressed as Relative Absorbance (mitochondrial dehydrogenase activity) with non-specific siRNA is expressed as 1. (B) Annexin V FITC/PI staining of HT29 cells was examined by a flow cytometer. Results are presented as mean ± SD of at least four independent experiments (* P<0.05, ** P<0.01, *** P<0.001).

