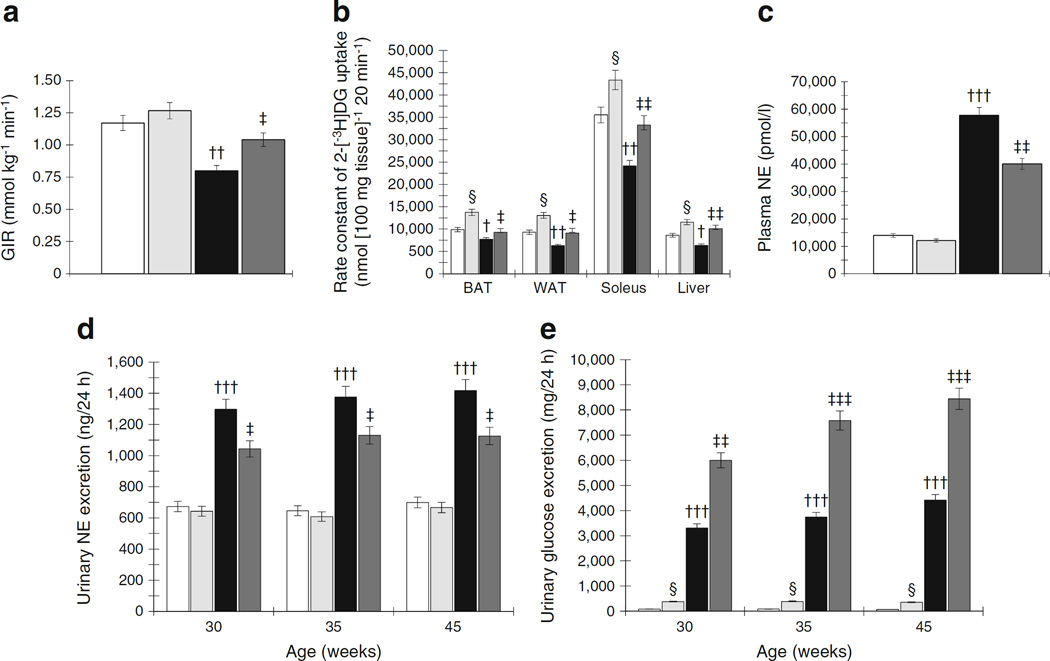
Fig. 3.
(a) OLETF rats show lower GIR during the hyperinsulinaemic– euglycaemic clamp study, which is increased by RDX. (b) During rate constant net tissue uptake of 2-[3H]DG measurement, OLETF rats show lower glucose uptake in BAT, WAT, soleus muscles and liver tissues compared with LETO rats. RDX improves glucose uptake by these tissues in OLETF rats. (c, d) OLETF rats show elevated plasma NE levels (c) and urinary NE excretion (d), which are suppressed by RDX. (e) OLETF rats show higher urinary glucose excretion, which is further increased by RDX. †p<0.05, ††p<0.01, †††p<0.005 LETO vs OLETF; ‡p<0.05, ‡‡p<0.01, ‡‡‡p<0.005 OLETF vs OLETF+RDX; §p<0.05 LETO vs LETO+RDX. White bars, LETO group; black bars, OLETF group; light grey bars, LETO+RDX; dark grey bars, OLETF+RDX

