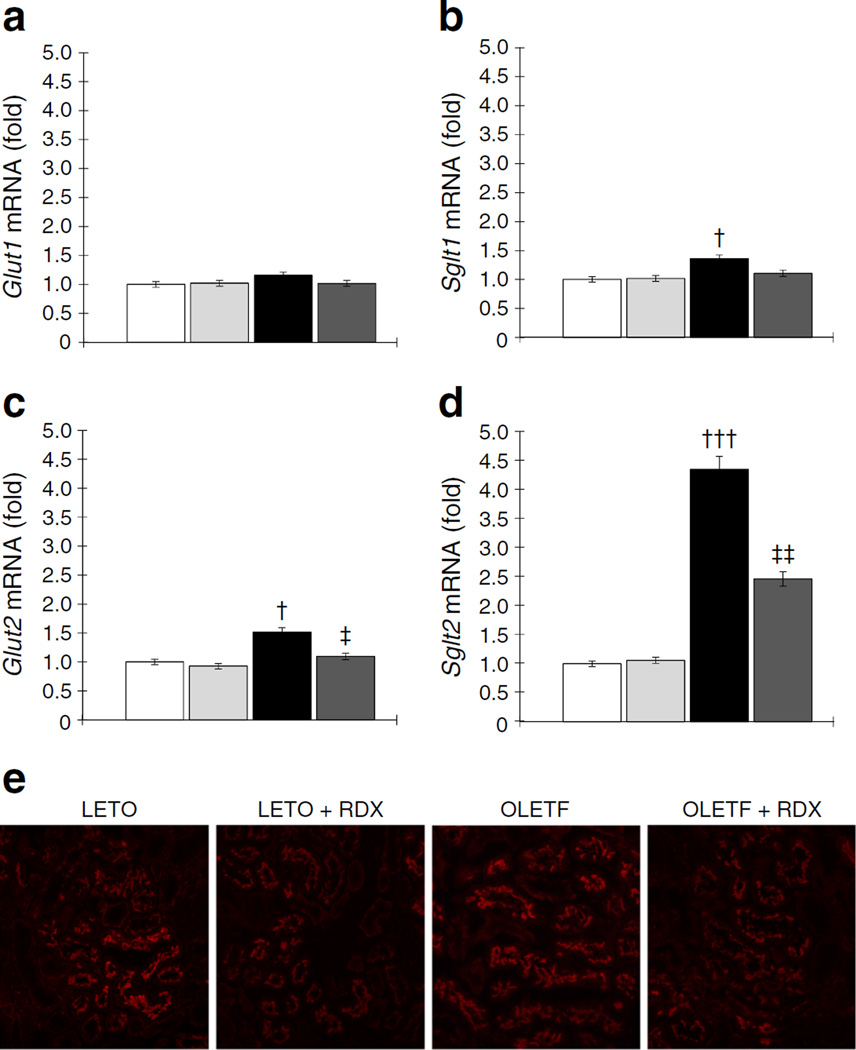
Fig. 4.
(a) Glut1 mRNA levels are similar among the treatment groups. (b, c) Sglt1 (b) and Glut2 (c) mRNA expression is upregulated. (d) Sglt2 mRNA level is markedly upregulated in OLETF rats, which is suppressed by RDX. (e) Immunofluorescence micrographs of staining with anti-SGLT2 antibody (red fluorescence) (original magnification, ×200). The staining intensity is weaker in OLETF+RDX than OLETF. All mRNA data are expressed as the relative difference in expression compared with LETO rats after normalisation for β-actin expression. †p<0.05, †††p<0.005 LETO vs OLETF; ‡p<0.05, ‡‡p<0.01 OLETF vs. OLETF+RDX. White bars, LETO group; black bars, OLETF group; light grey bars, LETO+RDX; dark grey bars, OLETF+RDX

