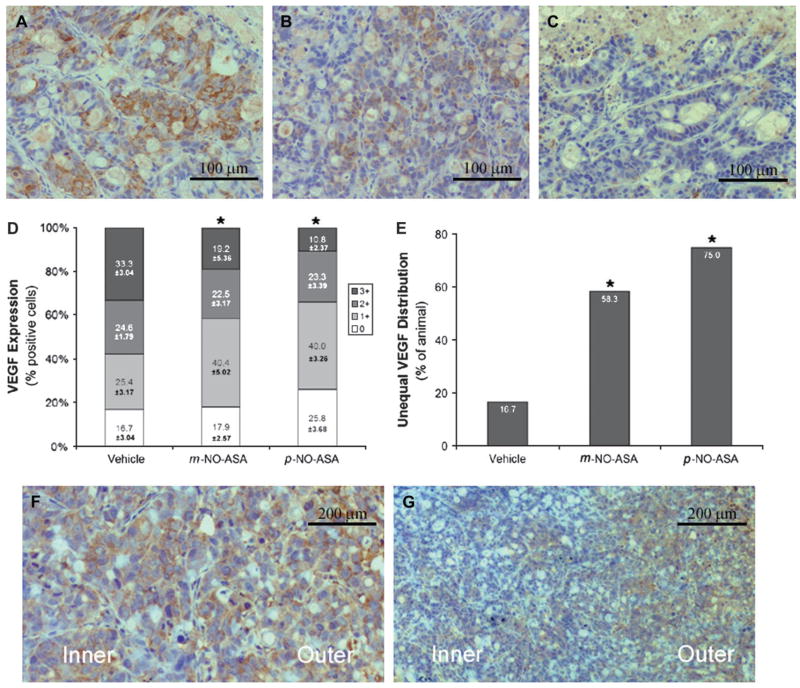
Fig. 4.
The effect of NO-ASA on VEGF expression in HT-29 xenografts. VEGF expression: representative sections of tumors injected with vehicle (A), m-NO-ASA (B) or p-NO-ASA (C) that were stained for VEGF expression. (D) The percentage of tumors showing each level of VEGF staining intensity. Unequal VEGF distribution pattern: representative sections of tumors injected with vehicle (F) or m-NO-ASA (G) that depict the equal (F) and unequal (G) VEGF distribution patterns between the inner and outer regions of the non-necrotic tumor tissue. The percentage of animals showing the unequal distribution pattern is shown in (E). *Statistically significant difference compared with the vehicle control group. Original magnification ×400 for A, B and C and ×200 for F and G. *Statistically significant difference compared with the vehicle control group. The bar represents 100 μm (A, B and C) or 200 μm (F and G).

