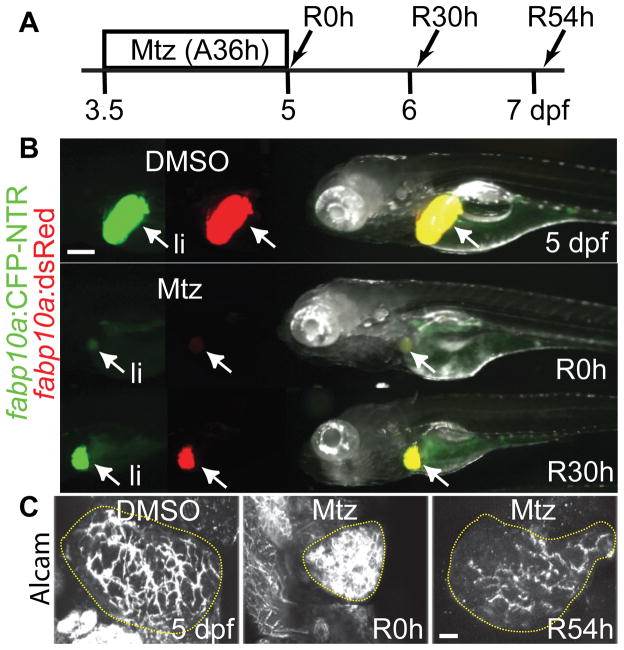
Figure 1. A zebrafish liver injury model.
(A) Scheme illustrating the periods of Mtz treatment and liver regeneration. (B) 36-hour Mtz treatment greatly reduced liver size and fabp10a:CFP and fabp10a:dsRed fluorescence at R0h; however, strong CFP and dsRed fluorescence reappeared at R30h. Arrows point to the liver (li). (C) Confocal projection views of the entire liver immunostained with anti-Alcam antibodies that labelled BECs. The intrahepatic biliary network was collapsed at R0h but rapidly re-established at R54h. Dotted regions outline the liver. Scale bars: 100 (B), 20 (C) μm.

