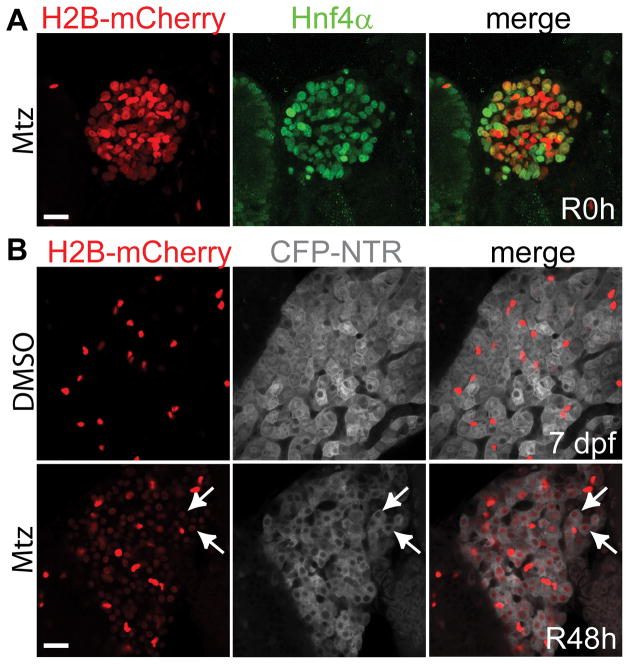
Figure 2. BECs give rise to hepatocytes upon severe hepatocyte loss.
(A) Confocal projection views of the liver showing Hnf4α (green) and Tp1:H2B-mCherry (red) expression at R0h. (B) Confocal single-optical section images showing fabp10a:CFP-NTR (grey) and Tp1:H2B-mCherry (red) expression in the liver. mCherry expression was revealed by anti-mCherry immunostaining. Note the weak mCherry expression in the nuclei of CFP+ hepatocytes (arrows). Strong mCherry+ cells are BECs. Scale bars: 20 μm.

