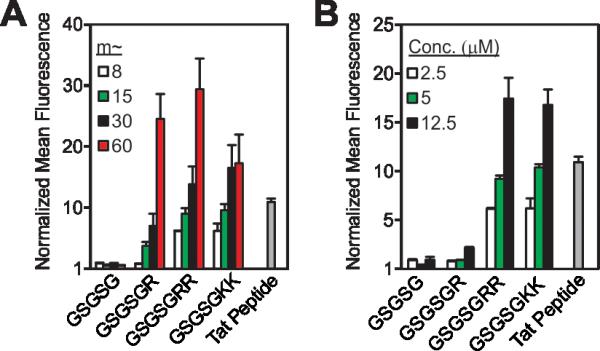
Figure 2.

Strategies for increasing cellular uptake of GSGSG analogues. Flow cytometry data exploring the impact of (A) degree of polymerization with each polymer at a concentration of 2.5 μM and (B) the concentration of m ~ 8 polymers. All data are normalized to DPBS at a value of 1 and concentration is with respect to fluorophore content. Data for additional polymers are shown in Figures S10-11.
