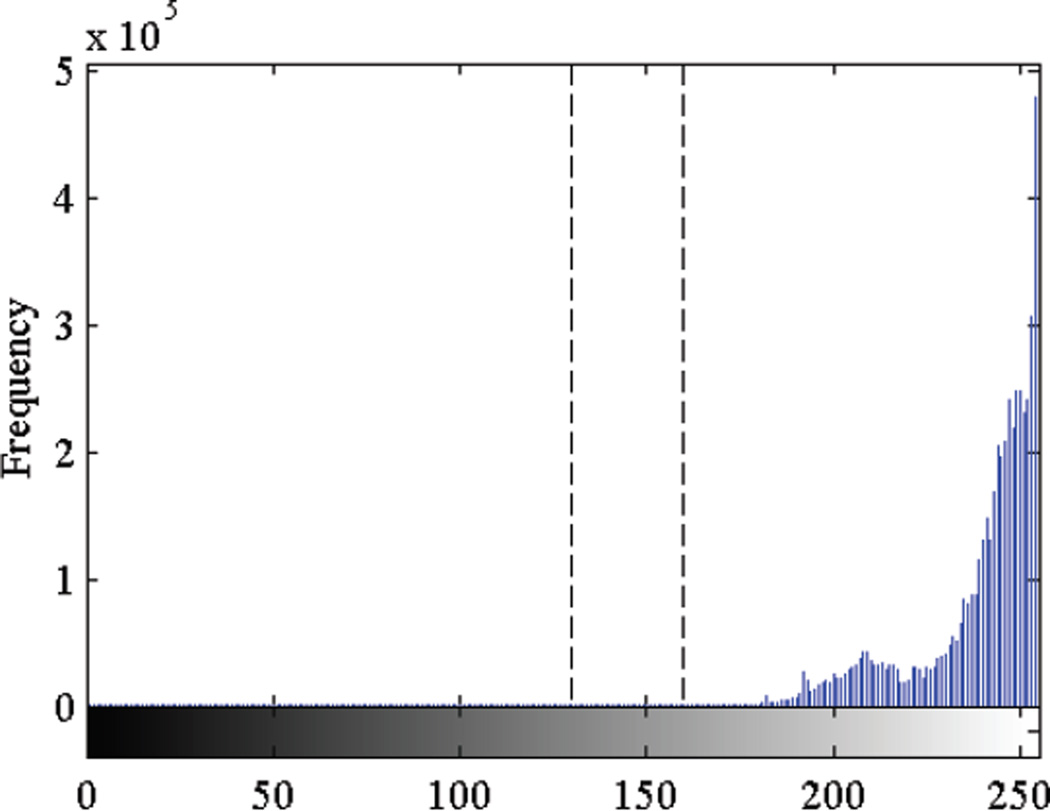
FIGURE 3.
A histogram of the grayscale ECG image where the separation between desired signal component (lower pixel intensity) and the graphical grid (higher pixel intensity) is observed in the range 130–160. Empirically, we determined that a threshold in this region will ensure efficient removal of the graphical grid from the ECG image.

