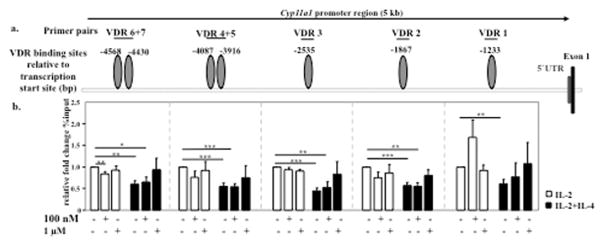
Figure 3. 1,25D3 mediated VDR recruitment to the Cyp11a1 promoter region is altered in CD8+ T cells differentiated in IL-2 or IL-2+IL-4 in the presence or absence of 100 nM or 1 μM 1,25D3.
(a) Localization of VDR binding sites and qPCR primers in the Cyp11a1 promoter region. (b) qPCR was performed using five Cyp11a1 promoter-specific primers covering seven VDR binding sites. Data were analyzed via the percent input methodology: (2^ (CT of total input – CT of specific IP)) x100 and relative percent input ratios using CD8+ T cells stimulated with IL-2 as baseline. Data (relative fold change+SEM) are from three independent experiments. Linear mixed models were employed; pairwise comparisons were performed using t-tests derived from these models. *p<0.05, **p<0.01, ***p<0.001 compared to the IL-2 group, these p-values remained significant after correction for multiple comparisons; p-values that did not reach the threshold p-value after adjustment for multiple comparisons (Benjamini-Hochberg57 correction) are shown numerically. No statistical significance was detected compared to the IL-2+IL-4 group.

