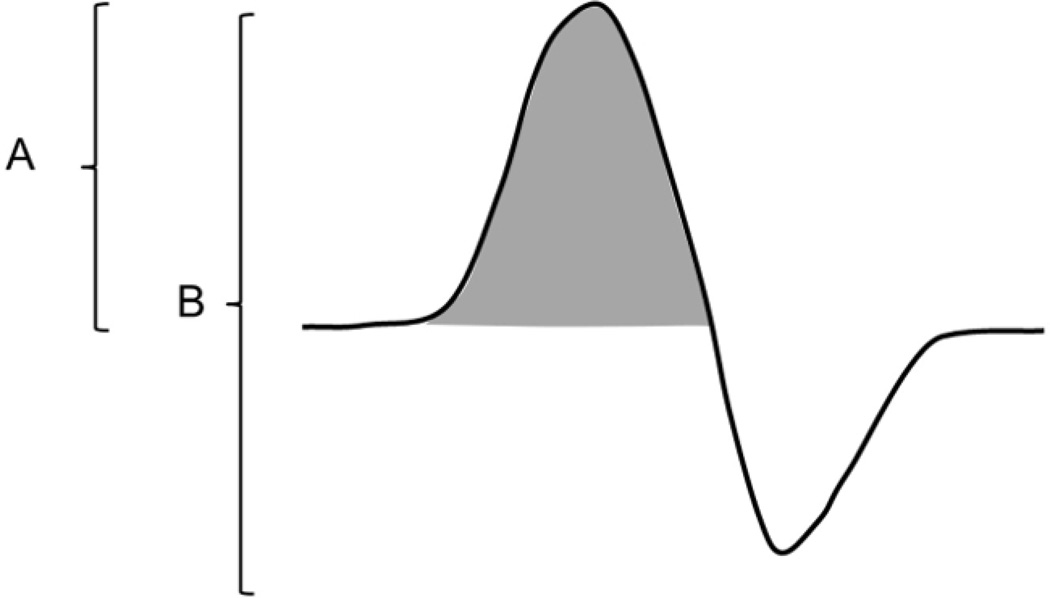
Figure 2. Compound Muscle Action Potential.
Pictured is an illustration of a representative CMAP response. (A) The baseline-to-peak amplitude is measured from the isoelectric baseline to the initial negative peak (negative voltage is depicted above the baseline). (B) The peak-to-peak amplitude is measured from negative peak voltage to positive peak voltage. The grey-shaded area denotes the negative peak area.

