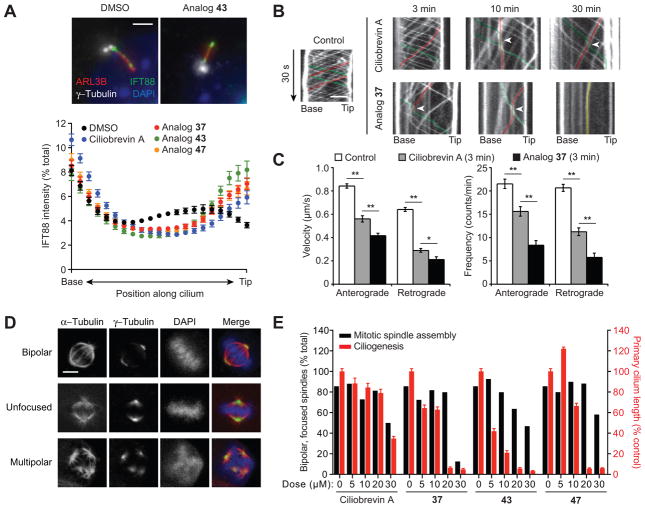
Figure 4. Selective inhibition of cellular cytoplasmic dynein 2 function by benzyl ether-functionalized ciliobrevins.
(A) Effects of the designated compounds (50 μM; 1 hour) on ciliary IFT88 transport in an NIH-3T3 cell-derived line, using ARL13B and γ-tubulin staining to define the axoneme and base, respectively. Each axoneme was divided into 21 bins, and the IFT88 signal intensity within each bin was normalized to the total ciliary signal using MatLab R2014A (Mathworks). Data represent the average IFT88 signal intensities for at least 70 cilia ± s.e.m. Representative images of DMSO- or ciliobrevin analog-treated cells are shown. Scale bar: 2 μm. (B) Line scan kymographs demonstrating the movement of mNeonGreen-IFT88 foci in the cilia of IMCD3 cells. Cells were treated with 15 μM ciliobrevin A (1), analog 37, or an equivalent amount of DMSO vehicle for 3, 10, or 30 min. Representative tracks for anterograde (green), retrograde (red), or immobile (yellow) IFT foci are highlighted. Arrowheads indicate velocity changes for anterograde IFT foci, which are rarely observed in control cells but frequently occur when anterograde IFT encounter retrograde or immobile IFT foci in ciliobrevin A- or analog 37-treated cells. Scale bar: 2 μm. (C) Quantification of the average velocity and frequency of mNeonGreen-IFT88 foci movements in control IMCD3 cells and those treated with 15 μM ciliobrevin A or analog 37 for 3 min. Data are the average velocities or frequencies ± s.e.m., and at least 7 cilia from three independent experiments were quantified for each condition. Single and double asterisks indicate P < 0.05 and P < 0.01, respectively. (D) Representative mitotic spindle phenotypes observed in an NIH-3T3 cell-derived line arrested with 15 μM MG132 (90 min) and then treated with either DMSO or ciliobrevin analogs (30 min). Scale bar: 5 μm. (E) Quantification of the mitotic spindle assembly (black bars) and ciliogenesis (red bars) phenotypes. At least 200 mitotic spindles were scored for each condition, and primary cilium lengths were determined as described in Figure 2F.

