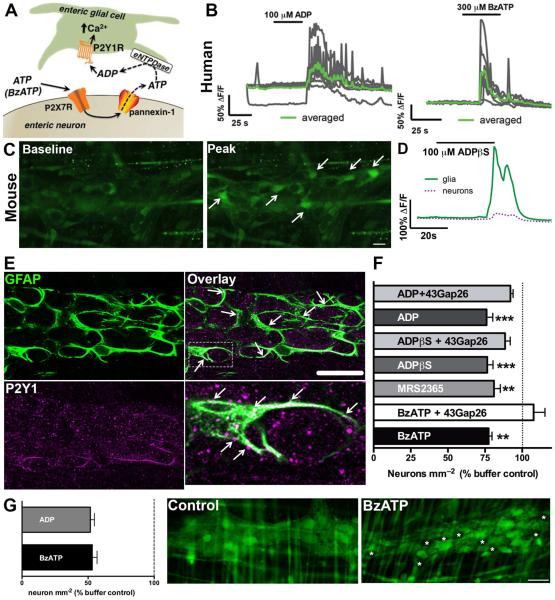
Figure 1.
Activation of enteric glial P2Y1Rs drives neuron death through a Cx43-dependent mechanism. (A) Schematic depicting how activation of neuronal P2X7Rs elicits Ca2+ responses in enteric glia. (B) Representative traces of in situ Ca2+ imaging of human myenteric glia. As in mice, human glia respond to the P2Y1R agonist, ADP and to the neuronal release of ATP stimulated by the P2X7R agonist, BzATP. Gray traces show responses of individual glial cells within a ganglion and the averaged response of all glia within the ganglion is overlaid in green. Traces are representative of recordings from at least 4 myenteric ganglia from the human jejunum. (C–D) In situ Ca2+ imaging of the mouse myenteric plexus demonstrates that P2Y1R agonists primarily elicit Ca2+ responses in enteric glia. (C) Representative images of Fluo-4 fluorescence in a myenteric ganglion from the mouse colon at rest (baseline) and at peak stimulation (at time = 60seconds) with the non-hydrolysable P2Y1R agonist, ADPβS. Arrows point to representative enteric glia. (D) Averaged Ca2+ responses of glia (green line) and neurons (magenta dashed line) within a myenteric ganglion from the mouse colon in response to ADPβS. Traces are representative of responses in over 5 myenteric ganglia. (E) Representative mouse myenteric ganglion showing immunoreactivity for P2Y1Rs (magenta). Enteric glia are labeled with the glial cell marker glial fibrillary acidic protein (GFAP; green) and arrowheads highlight areas of co-localization (scale bar, 30 μM). The boxed region in the overlay image at top right is expanded in the bottom right panel to highlight a glial cell with dense P2Y1R expression. (F) Mean packing density of HuC/D-immunoreactive neurons in myenteric ganglia after in situ activation of P2Y1Rs with the agonists ADP, ADPβS and MRS2365 or activation of P2X7Rs with BzATP in the presence or absence of the Cx43 inhibitor 43Gap26 (n = 3-5 animals, **P≤0.01, ***P≤0.005 ANOVA). (G) Mean packing density of live enteric neurons in myenteric ganglia following in situ neuroinflammation with BzATP, ADP or buffer control, quantified by Calcein-AM fluorescence. Representative images show viable cells, labeled with fluorescent Calcien-AM (green), in mouse myenteric ganglia from control and BzATP-treated tissues. Dead (non-fluorescent) neurons are denoted by asterisks (scale bar, 30 μM), (n = 3-4 animals).

