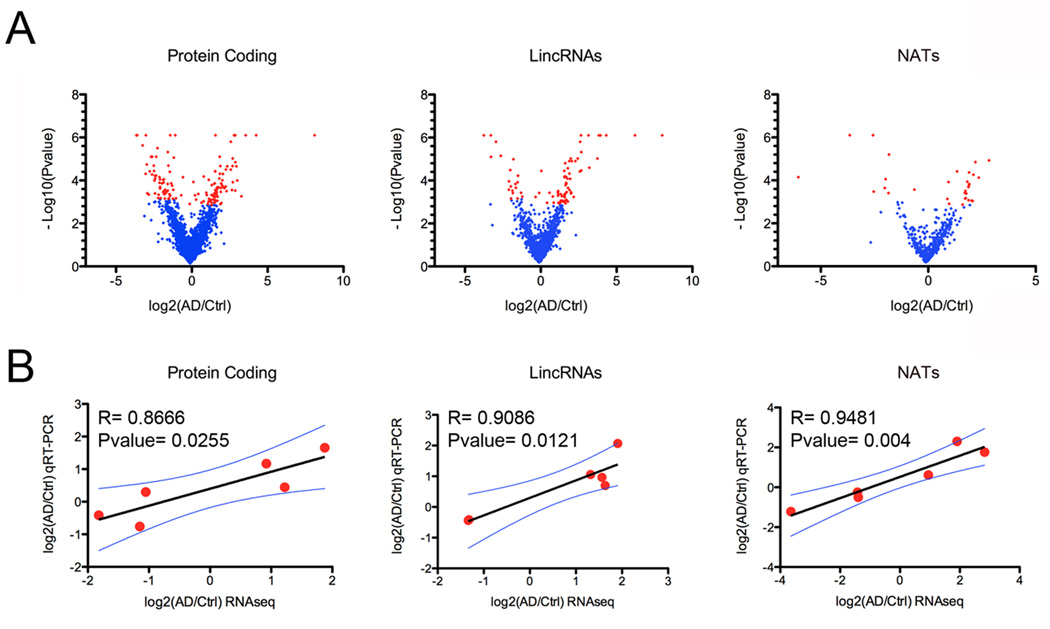
Figure 2. Differential expression analysis.
A) Volcano plots revealing significant changes (Blue points; pfp<0.1: minimum reads coverage of 20) in the expression of protein coding genes, antisense and lincRNAs in the hippocampi of AD patients (n=4) compared to control (n=4). B) Technical validation of RNAseq differential expression analysis using qRT-PCR showing high degree of correlation between log2 fold change differences from RNAseq and qRT-PCR data for 6 different protein coding genes, 6 lincRNAs and 6 AS RNA transcripts.

