Figure 5.
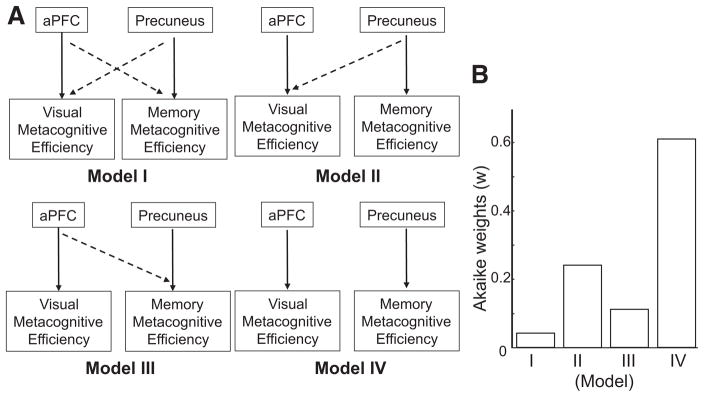
Model comparison. A, Schematic description of the models. These models characterize the possible ways of explaining the positive behavioral correlation between memory and visual metacognitive efficiencies. In Model I, the solid arrows indicate that the aPFC is mainly functionally responsible for visual metacognitive efficiency, and the precuneus is mainly functionally responsible for memory metacognitive efficiency. The dashed lines indicate that there may be some degree of functional crosstalk between the two systems, such that the precuneus may also be partially responsible for visual metacognitive efficiency and the aPFC may also be partially responsible for memory metacognitive efficiency. Models II and III are variants in which the crosstalk is one-sided. In Model IV, there is no functional crosstalk, i.e., the precuneus is functionally responsible for only memory but not visual metacognitive efficiency, and the PFC is functionally responsible for only visual but not memory metacognitive efficiency. In this model, the behavioral correlation between visual and memory metacognitive efficiency is accounted for entirely by the covariation in volume between the precuneus and the PFC across individuals (as shown in Fig. 4). B, Model statistics and comparison. AIC model selection was used to estimate which of the four models (in A) was most likely. AIC quantifies goodness of model fits by rewarding close fits to data while penalizing model complexity (number of model parameters), because more complex models are prone to overfitting. Akaike weights calculated from the AIC values can be interpreted as the probability that that particular model is best. Thus, Model IV fits the data best.

