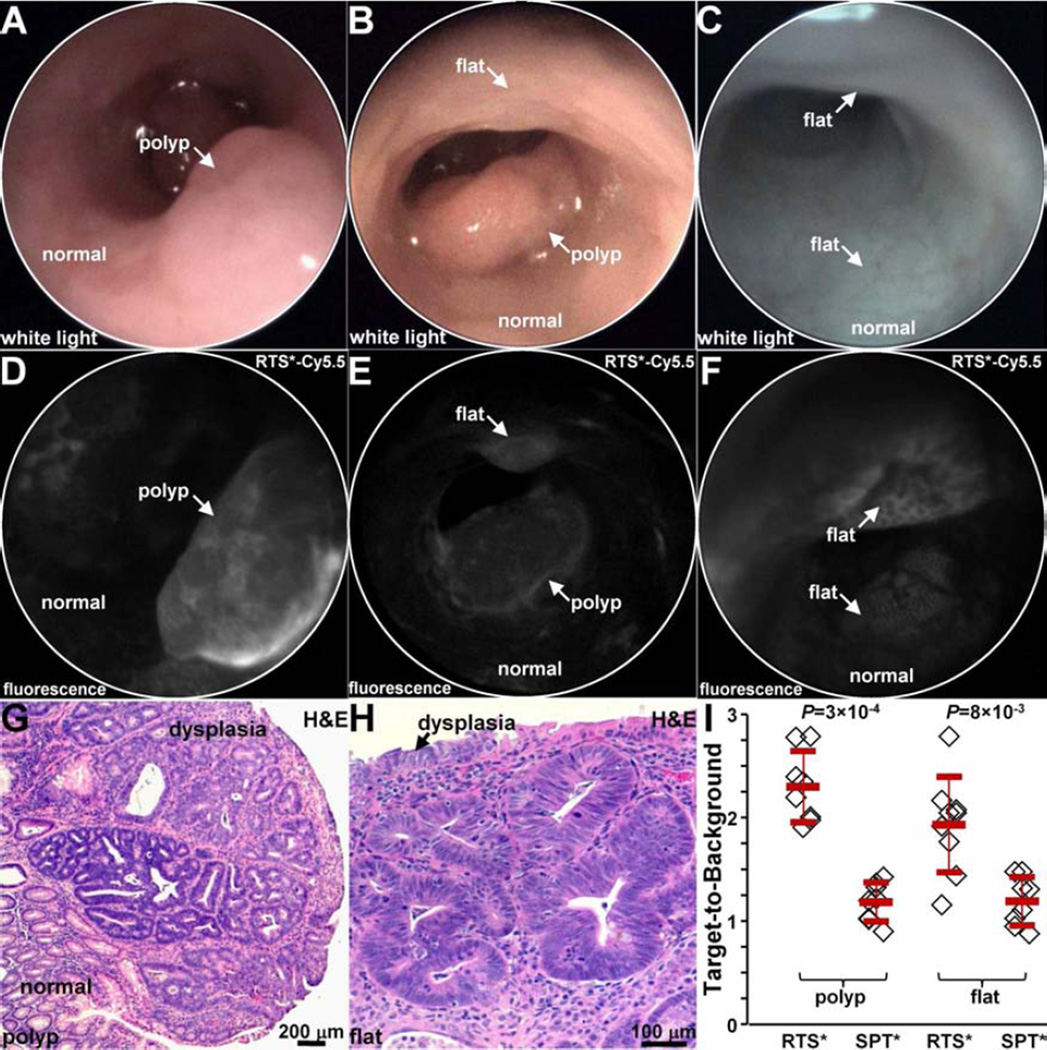
Fig. 7. In vivo imaging in CPC;Apc mouse colon.
White light images show A,B) a spontaneous polyp (arrow) and C) normal appearing mucosa. NIR fluorescence images after topical administration of RTS*-Cy5.5 shows D) increased intensity from polyp (arrow) in A), E) presence of flat lesion above polyp in B), and F) flat lesions not apparent on white light image in C). Representative individual images were extracted from videos recorded at 15 frames per second that showed minimum motion artifact and absence of debris (stool, mucus). Histology (H&E) of G) polyp in A) and H) flat lesion in B) shows features of low-grade dysplasia. I) From n = 5 mice, RTS*-Cy5.5 had a higher mean (±std) T/B ratio than SPT*-Cy5.5 for n=8 polyps (2.3±0.3 and 1.2±0.2, respectively, P=3×10⁻⁴ by paired t-test) and n = 9 flat lesions (1.9±0.5 and 1.1±0.2, respectively, P=8×10⁻³ by paired t-test).

