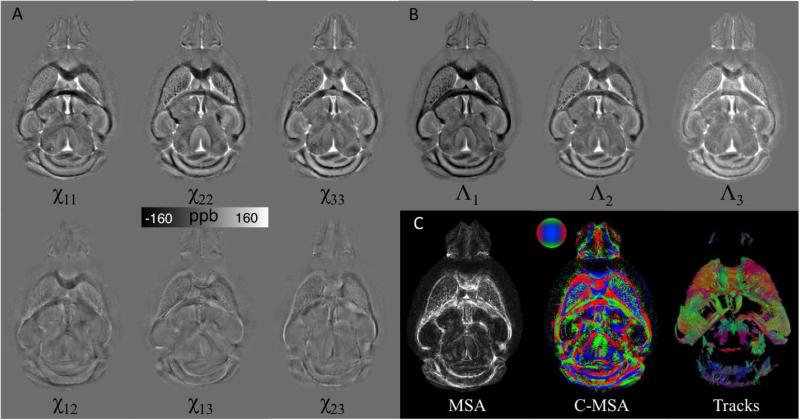
Fig. 3.
Illustration of STI on a mouse brain. Mouse brain was perfusion fixed with formalin and stained with Gd contrast agent. 3D Multi-echo GRE data were acquired in 12 specimen directions on a small-bore animal 7T scanner. A. The 6 independent tensor elements of a representative slice. B. Λ1, Λ2, and Λ3 are the 3 eigenvalues representing the principal susceptibilities. C. Magnetic susceptibility anisotropy (MSA) and the color coded MSA were calculated based on the associated eigenvector orientations. Fiber tracking was performed using Diffusion Toolkit in a similar process to DTI and results were visualized using TrackVis. The track image shows the tracks intersecting 10 adjacent slices.

