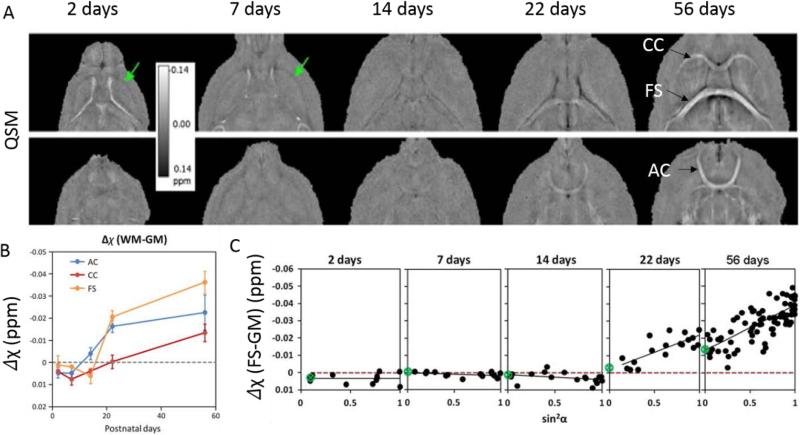
Fig. 6.
A. Examples of magnetic susceptibility maps of the developing mouse brain. White matter largely appears paramagnetic relative to gray matter in PND2 and PND7 while contrast is weak at PND14. At PND22 and PND56, white matter appears diamagnetic. B. Magnetic susceptibility contrast of selected white matter regions relative to neighboring gray matter as a function of age. C. Apparent magnetic susceptibility of the fornix system as a function of sin2α where α is the fiber angle with respect to B0. The slope of the fitted trend line increases as the brain develops indicating increasing anisotropy. The scan parameters are: isotropic resolution = 59 × 59 × 59 μm3, matrix = 368 × 184 × 184, flip angle = 40°, TE = 20msec, TR = 200 msec. Figure was reproduced with permission from Argyridis et al (66).

