
Figure 5. Regions with significant age and gender effects.
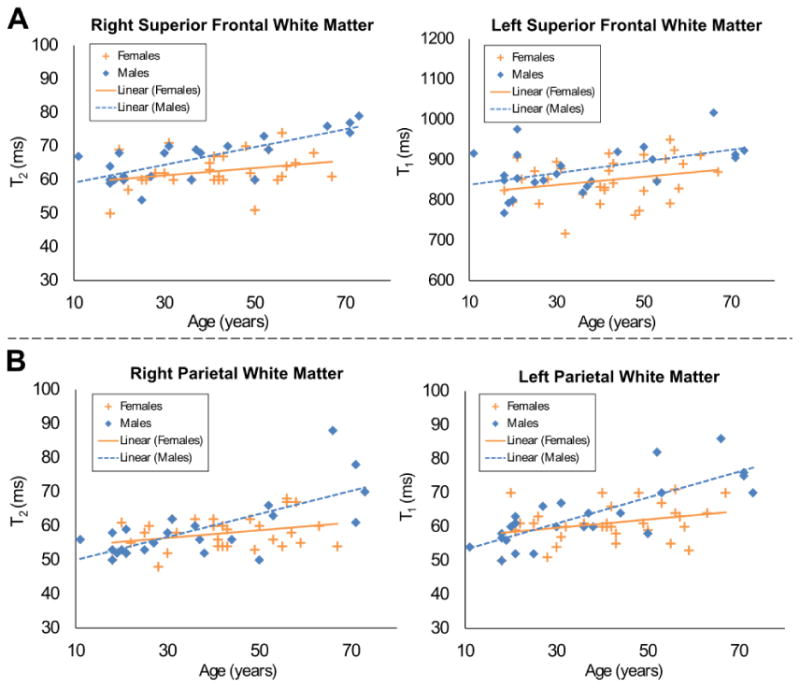
(A) Regions with significant linear age+gender effects; in these models, the slope of linear regression on age for males and females is similar but the intercepts are significantly different. (B) Regions with significant age*gender effect on T2 relaxometry; in this model, the slope of linear regression on age between males and females is statistically significant.