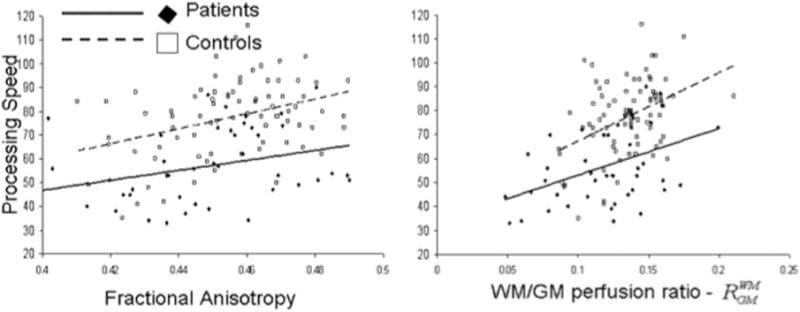
Figure 2.

Processing speed scores were plotted versus the whole-brain average FA (left) and RWM/GM perfusion ratio (right) for cerebral WM. Processing speed scores were significantly correlated with FA values (r = 0.35, P = 0.02 and r = 0.36, P = 0.005, in patients/controls, respectively) and with the RWM/GM ratios (r = 0.44, P = 4.5 × 10⁻³ and r = 0.41, P = 1.1 × 10⁻³, in patients/controls, respectively).
