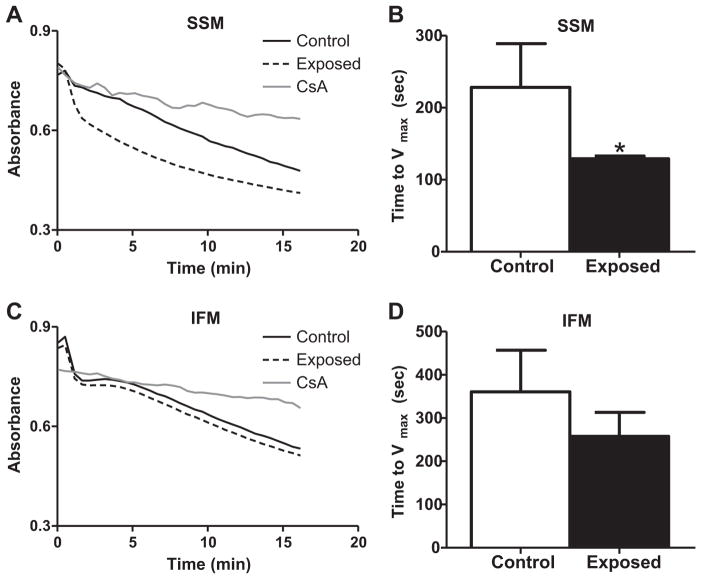
Fig. 5.
Mitochondrial permeability transition pore (mPTP) opening propensity. mPTP opening propensity from left ventricles of rats exposed by instillation to either vehicle control or PMMTM. Spectrophotometric analysis of mPTP opening propensity using the exogenous oxidant tert-butyl hydroperoxide (t-BuOOH) to induce mitochondrial swelling. Time to Vmax was assessed over a 15-min time period. Representative absorbance plots for SSM (A) and IFM (C). Solid lines represent control, dashed lines represent exposed, and dotted lines represent the internal control, cyclosporine A (CsA) treatment. Vmax data graphed for SSM (B) and IFM (D). Values are means ± SE; n = 6 for each group. *P < 0.05 for control vs. exposed.

