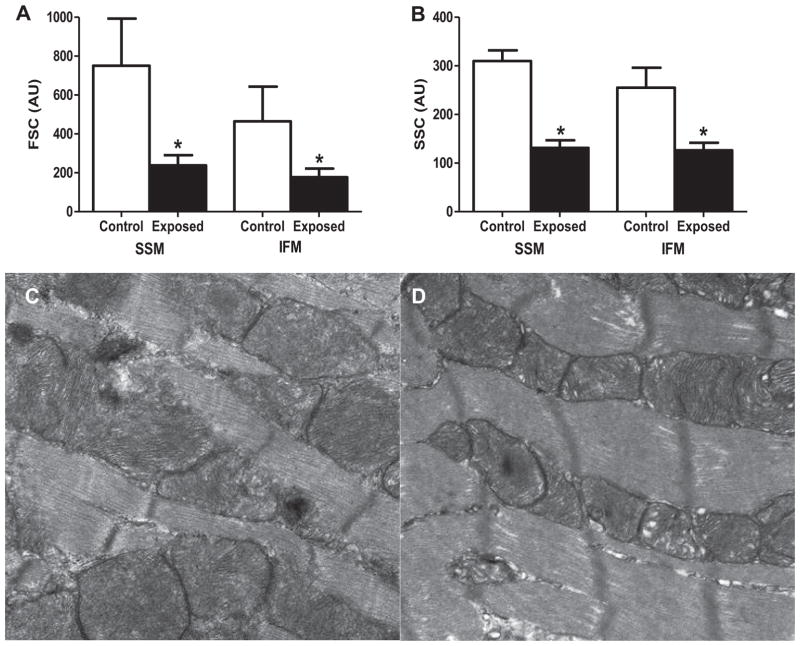
Fig. 7.
Mitochondrial morphological assessment. Relative size and internal complexity were analyzed using mitotracker deep red 633 and flow cytometry. A: analysis of cardiac SSM and IFM size (forward scatter, FSC) in control and exposed mitochondria subpopulations. B: analysis of cardiac SSM and IFM internal complexity (side scatter, SSC) in control and exposed mitochondrial subpopulations. Representative electron micrographs of left ventricle tissue from control (C) and PMMTM exposed (D) animals. Values for both FSC and SSC are expressed as AU ± SE; n = 8 for each group. *P < 0.05 for control vs. exposed.

