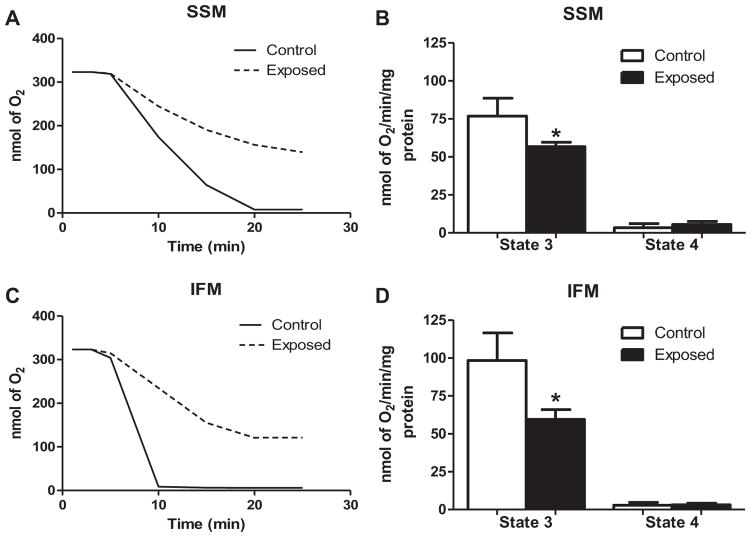
Fig. 8.
Mitochondrial respiratory capacity. Representative polarographic traces of oxygen consumption following addition of glutamate and malate to SSM (A) and IFM (C). Solid line traces represent mitochondria from control, and dashed line traces represent mitochondria from PMMTM-exposed animals. Summary analyses of state 3 and state 4 respiration rates from trace measurements of SSM (B) and IFM (D). Respiration rates are expressed in nmol·min−1·mg protein−1. Values are means ± SE; n = 6 for each group. *P < 0.05 for control vs. exposed animals.

