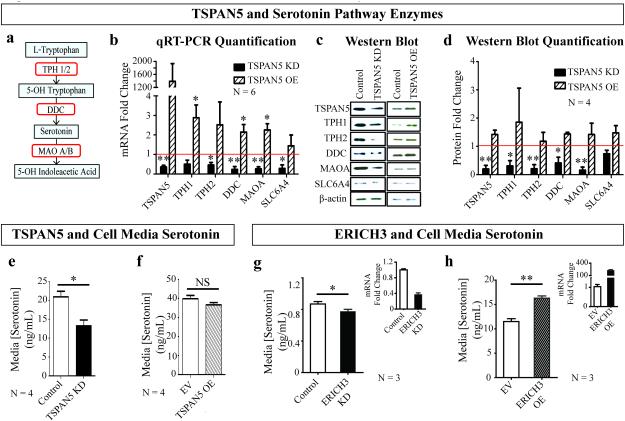
Figure 4. TSPAN5 and ERICH3 association with serotonin biosynthesis and metabolism.
(a) Serotonin biosynthesis and metabolism pathway. (b) mRNA expression of genes encoding serotonin pathway enzymes as measured by qRT-PCR were decreased after TSPAN5 KD (black) and increased after TSPAN5 OE (cross-hatched) in SK-N-BE(2) neuroblastoma cells. (c-d) Western blot analysis indicated decreased serotonin enzyme protein levels after TSPAN5 KD but no significant change after TSPAN5 OE, as quantified in (d). (e-f) Culture media serotonin concentrations after TSPAN5 (e) KD and (f) OE. (g-h) Cell culture media serotonin concentrations after ERICH3 (g) KD and (h) OE. * = p < 0.05; ** = p < 0.01; TPH 1/2 = Tryptophan Hydroxylase 1/2; DDC = Dopa Decarboxylase; MAO A/B = Monoamine Oxidase A/B; SLC6A4 = serotonin transporter; EV = Empty Vector.

