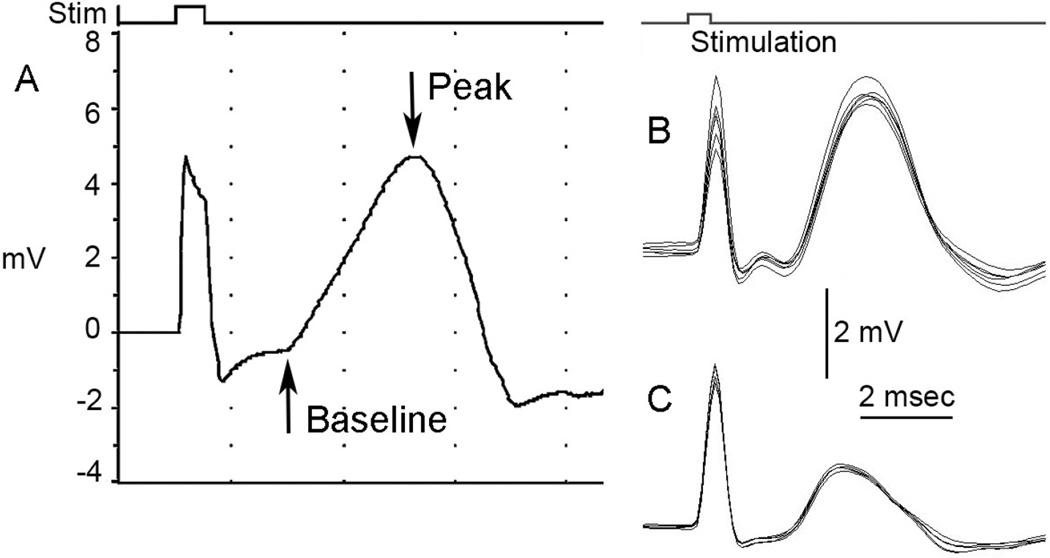
Figure 2. CMAP recordings and analysis.
(A) The amplitude of CMAP response can be measured from baseline to peak. A typical CMAP response should show both the stimulus artifact and response curve. (B–C) Representative average CMAP responses. Stimulation should be carried out at least ten consecutive times to obtain a repeated average of the response. Shown here are a laminectomy-only uninjured rat (B) and a comparison of CMAP responses for an injured rat that received a unilateral C4 hemi-contusion (C). Please click here to view a larger version of this figure.

