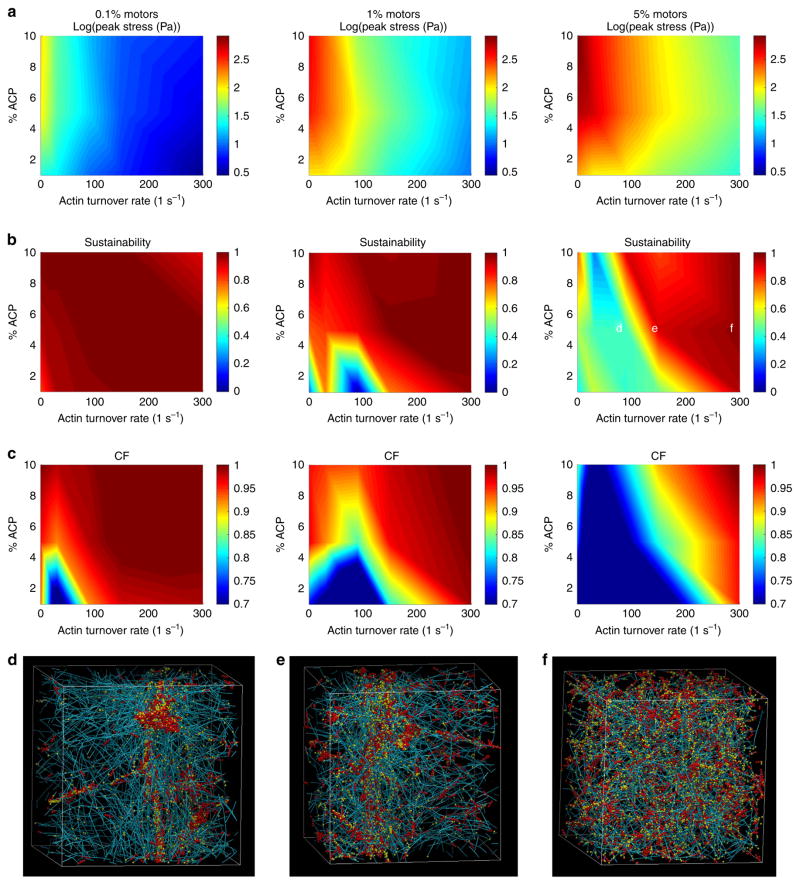
Figure 3. Mechanical phase transition of 3D cytoskeletal networks.
(a) The peak stresses, (b) stress sustainability factor (see Supplementary Note 2) and (c) clustering factor CF (see Supplementary Note 3) at t = 40 s after motor activation are plotted as a function of the actin turnover rate and % ACP. (See Supplementary Fig. 8 for CF heat maps at the end of simulation time). Each column represents a different motor concentration in the network. The actin concentration in these simulations is 25 μM. The peak stress (maximum stress exhibited by the network over time once the motors are activated averaged over a 10-s time interval) is reduced with increasing actin turnover rate and is enhanced with increasing motor concentration. The sustainability of the generated stresses and homogeneous network morphology tend to scale proportionately with ACP concentration and actin turnover rate and inversely with motor concentration. (d–f) Representative network morphologies of the indicated points in b 51 s after motor activation. Teal, yellow and red are actin filaments, ACPs and motors, respectively.

